 [bctt tweet=”School report cards: Student achievement in Wisconsin school districts is on the rise, according to brand new DPI data. See the trends in our summary of the latest K-12 school and district report cards. #wiedu #wipolitics #wiright” username=”MacIverWisc”]
MacIver News Service | Nov. 12, 2018
By Bill Osmulski
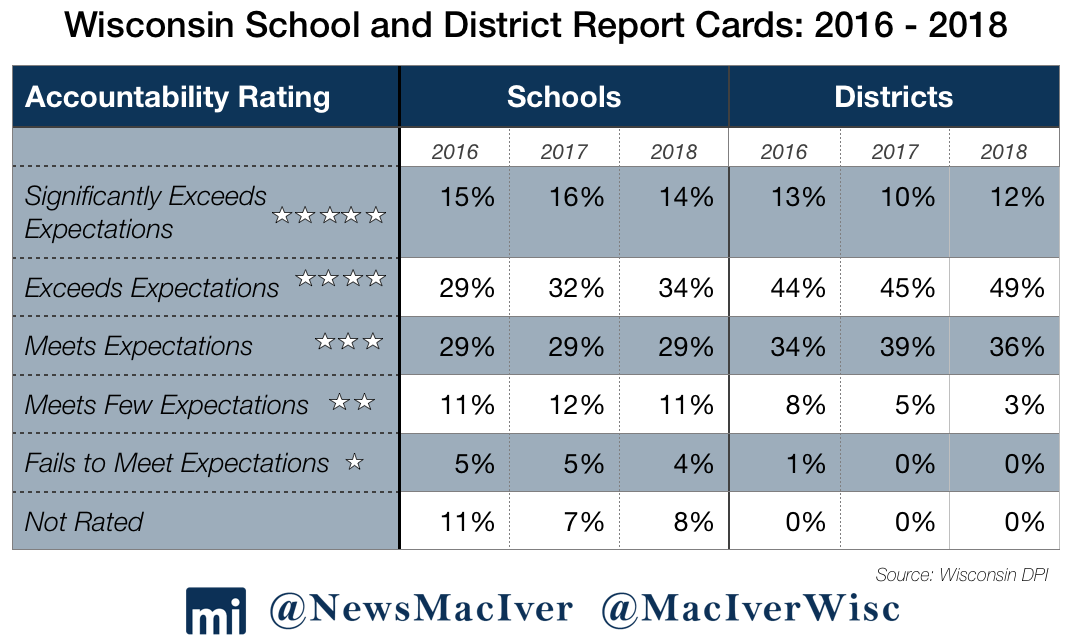
MADISON – Student achievement in Wisconsin school districts is on the rise, according to the Department of Public Instruction’s latest report cards released on Tuesday. But at the same time, individual schools are increasingly drifting away from both the highest and lowest scores towards the middle.
Most districts and schools are scored on a 0-100, five-star scale, from “failing to meet expectations” to “exceeding expectations.” A small percentage of districts and schools use alternative accountability measures, and receive scores of either “satisfactory progress” or “meets improvement.” The general trend is a noticeable shift towards the top of the rating scale and away from the bottom.
DPI pointed out another troubling trend during a conference call on Monday – the rise of absenteeism. Across the state, 125 schools took a hit for that.
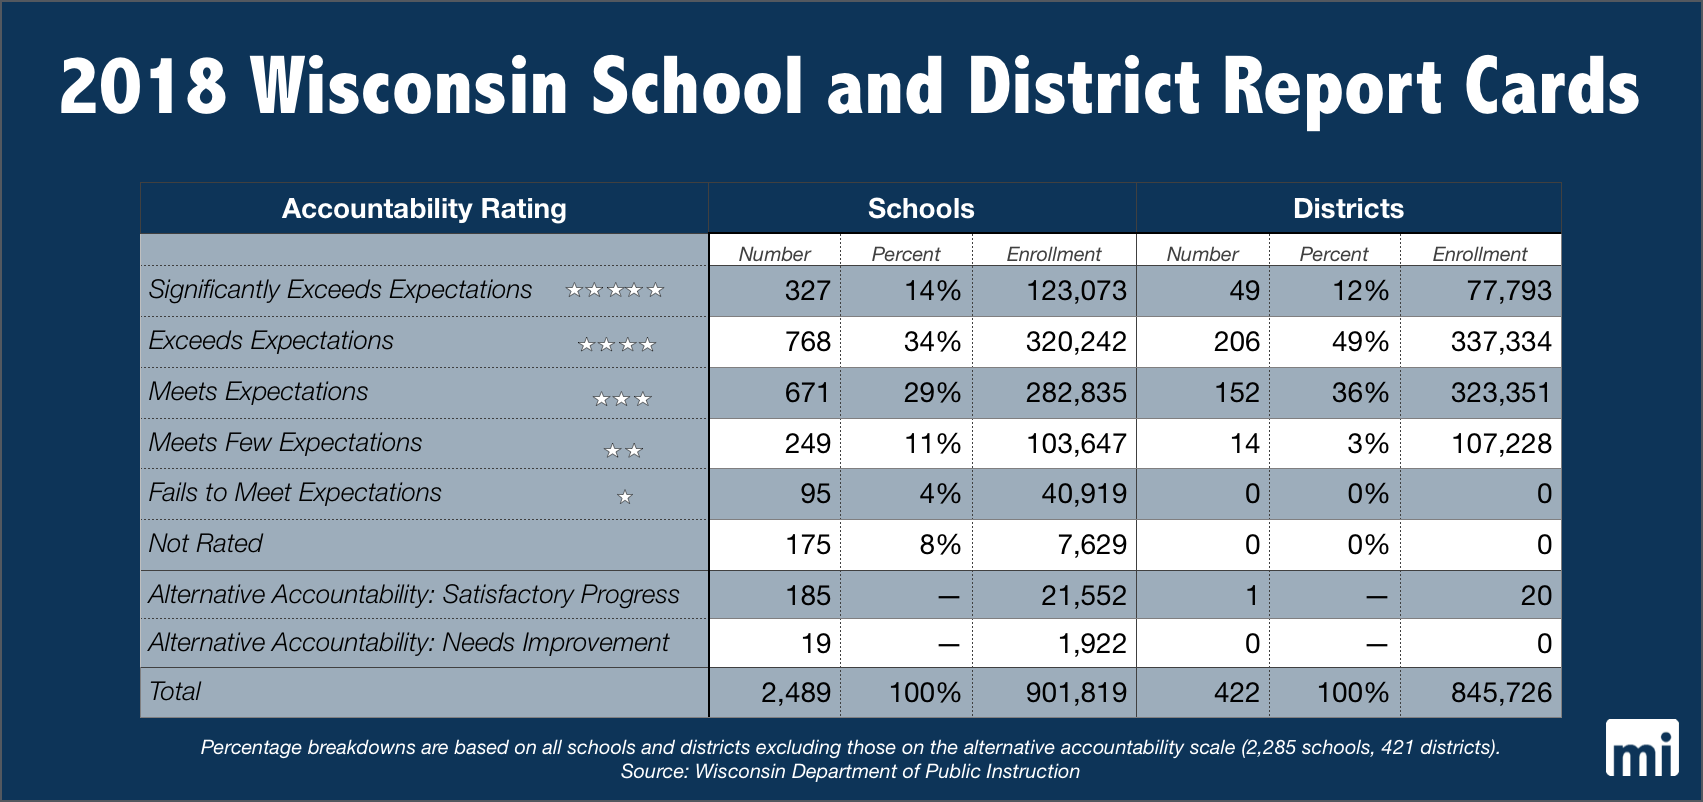
The bottom rating of one-star is “fails to meet expectations.” There were no one-star districts this year or last year.
A two-star district “meets few expectations.” This year there were 14 two-star districts, compared to 20 last year.
Next, a three-star district “meets expectations.” This year there were 152 three-star districts, down from last year’s 166.
Nearing the top of the scale, a four-star district “exceeds expectations.” This is where the largest growth took place. This year there are 206 four-star districts, while last year there were 190.
Finally, a five-star district “significantly exceeds expectations.” This year there are 49 five-star districts, compared to 44 last year.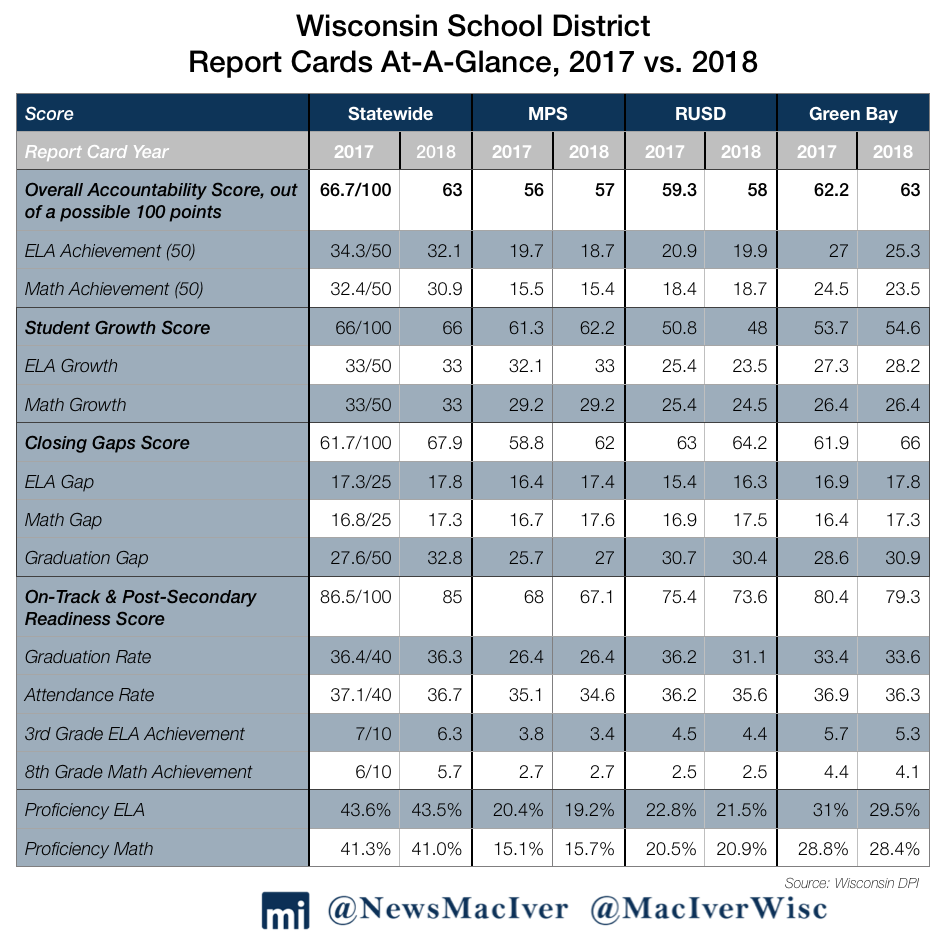
Mercer School District in Iron County had the lowest total score of 55.9 percent. The district has no students with limited English proficiency, 12 percent are minorities, and 22.5 percent have disabilities. Half of the students are economically disadvantaged, which DPI says is directly tied to performance.
“If a school has a greater proportion of students that are economically disadvantaged, there is a greater probability that its scores will be lower,” Debra Bougie, DPI Communications Specialist, said Monday. “That is a reality that exists. We’d like to buck that trend.”
One district that has overcome that trend is the Delavan-Darien school district. It has an overall score of 83.6 percent, a five-star score, and yet 64 percent of students in the district are economically disadvantaged, 20 percent have limited English proficiency, over half are minorities, and 17 percent have disabilities.
Bear in mind, however, that the scores are heavily weighted to allow disadvantaged districts to compete. And so, Delavan-Darien’s combined English and math score was 48.9, but other factors brought it up to 83.6 percent.
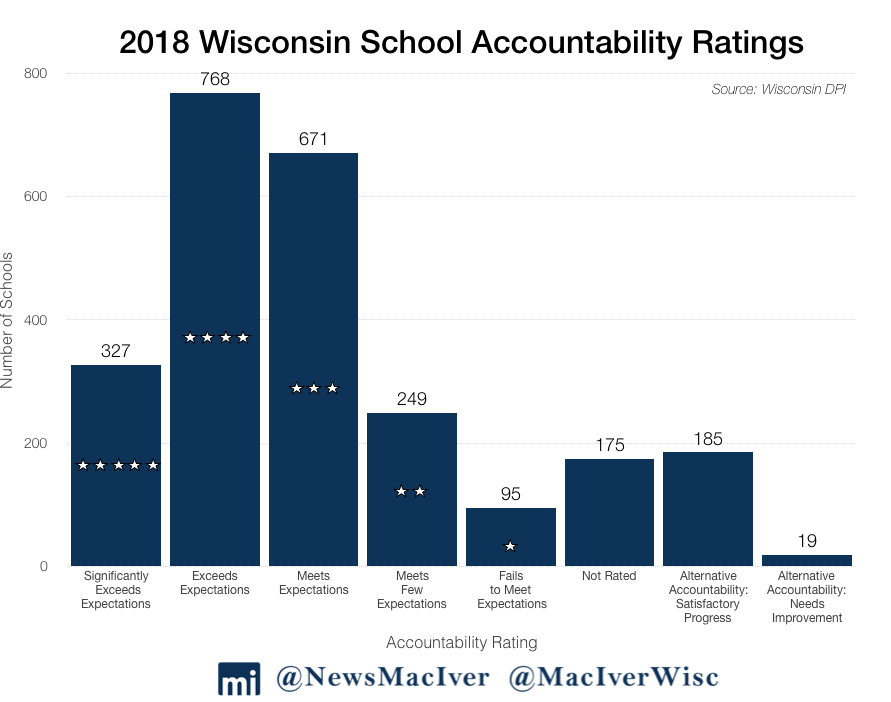
DPI also rates schools individually. Here the trend was for schools to move towards the middle. The number of one-star schools went down from 117 last year to 95 this year. Two-star schools went down from 261 to 250. Three-star schools went up from 643 to 671. Four-star schools went up from 719 to 768. Five-star schools went down from 361 to 327.
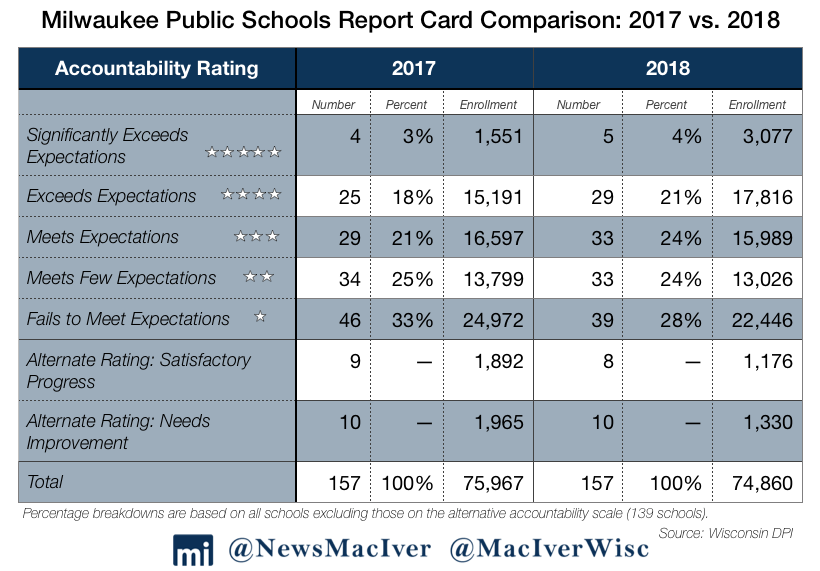
Most schools receive an overall accountability score on student achievement.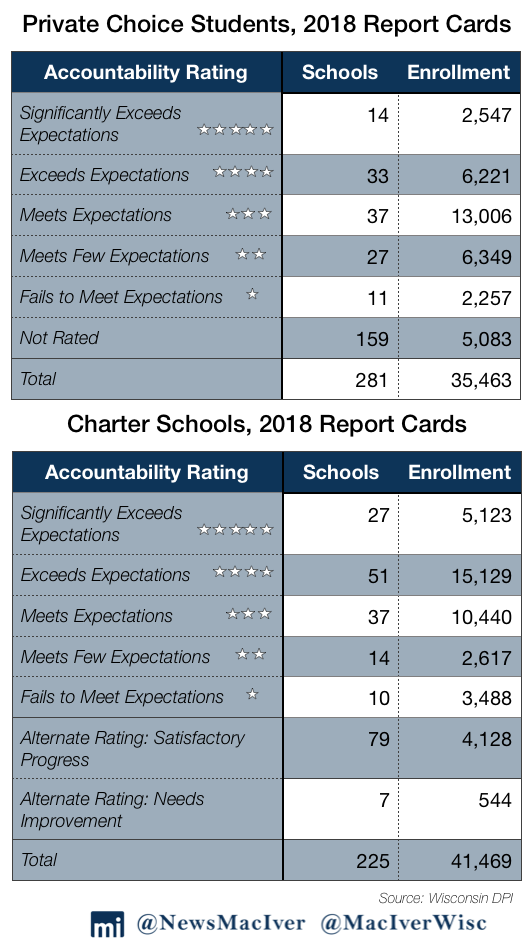
The best individual school in the state is Milton’s Consolidated Elementary with an overall accountability score of 99 percent. It has no students with limited English proficiency, 11 percent are economically disadvantaged, 10 percent have disabilities, and 96 percent are white.
TransCenter for Youth/El Puente High got the lowest score in the state at 10.3 percent. 92 percent of its students are economically disadvantaged, 95 percent are minorities, and 23 percent have limited English proficiency.
After TransCenter for Youth/El Puente High, the next seven worst performing schools are MPS high schools. North Division scored 22.5 percent, WHS scored 26.6, Pulaski got 26.9, Marshall 27, Bradley Tech reached 30.5, South Division got 31.2, and Vincent hit 31.4.
There are also 204 schools that receive “alternate ratings” that do not include an actual score. It involves a self-evaluation on raising student achievement in English and Math. Of the schools using this system, 185 were rated as “making satisfactory progress” and 19 were rated as “needing improvement.” Of the 19, ten are in MPS.
DPI pointed out another troubling trend during a conference call on Monday – the rise of absenteeism. Schools that don’t meet attendance goals are penalized 5 points in their total scores. Across the state, 125 schools took a hit for that.
“The schools that are starting to see these deductions are not the schools you’d think of when you think of absenteeism,” Tom McCarthy, DPI Communications director, said. “We don’t care if you’re deer hunting or on a college visit. If you’re not at school, you’re not there.”
