School choice students see stunning success, MPS slowly improving, fewer students overall attending failing schools
[bctt tweet=”The state’s latest report cards show a wealth of information about schools and districts from every corner of the state. Per DPI, the number of students attending failing schools has fallen, while more students attend top-rated schools. #wiedu” username=”MacIverWisc”]November 29, 2018
By Ola Lisowski
Wisconsin schools and districts appear to be trending in the right direction, according to the Department of Public Instruction’s latest report cards for the 2017-18 school year. Having already examined the results as a whole, let’s take the time to focus on some districts and schools of interest.
Milwaukee Public Schools (MPS)
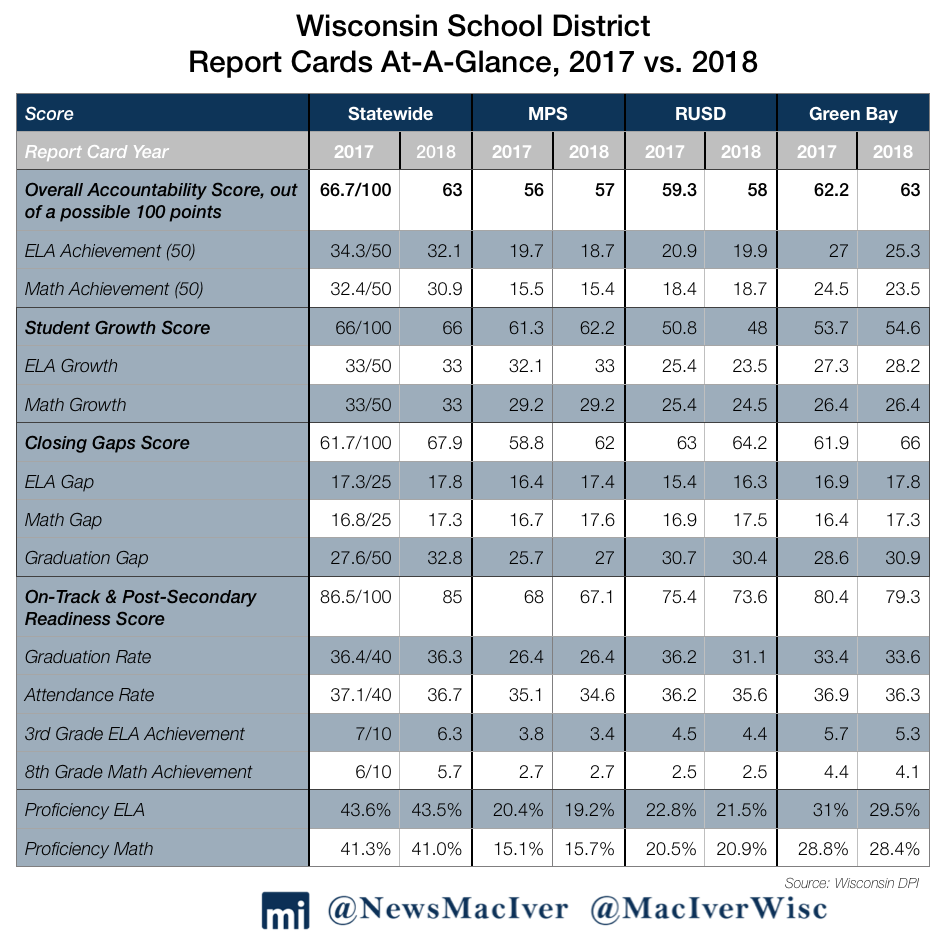
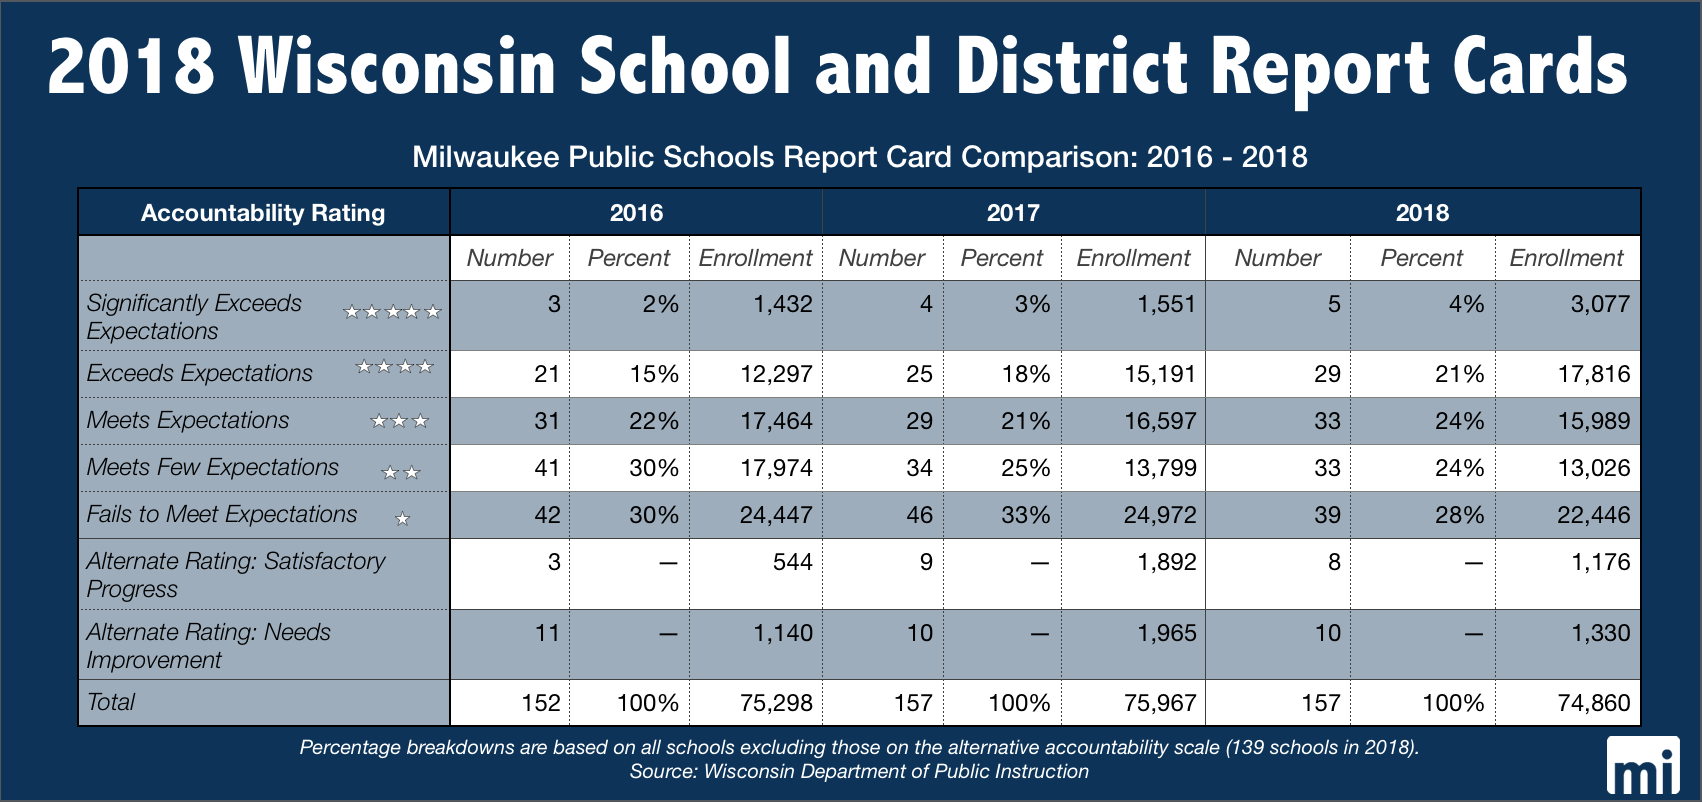
Milwaukee improved one point from last year, for a total overall score of 57 out of 100. That means MPS “meets few expectations,” a two-star rating for the state’s largest district.
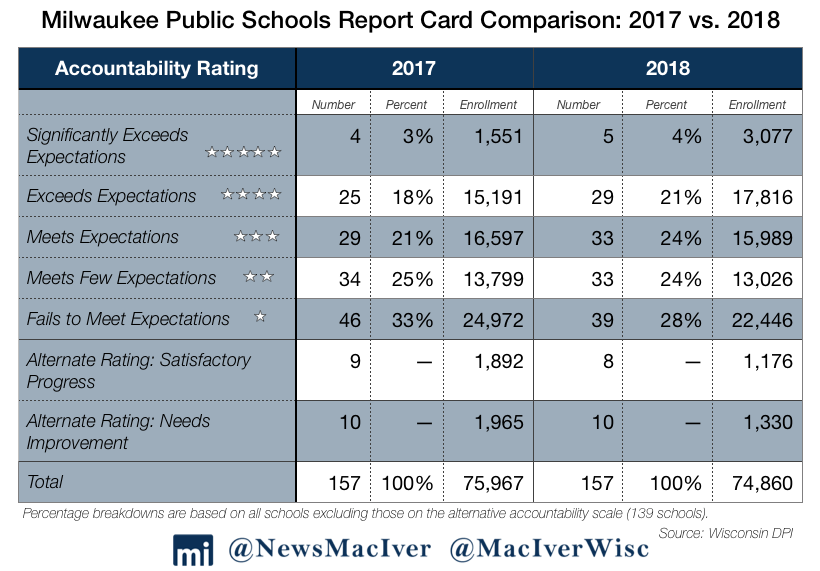
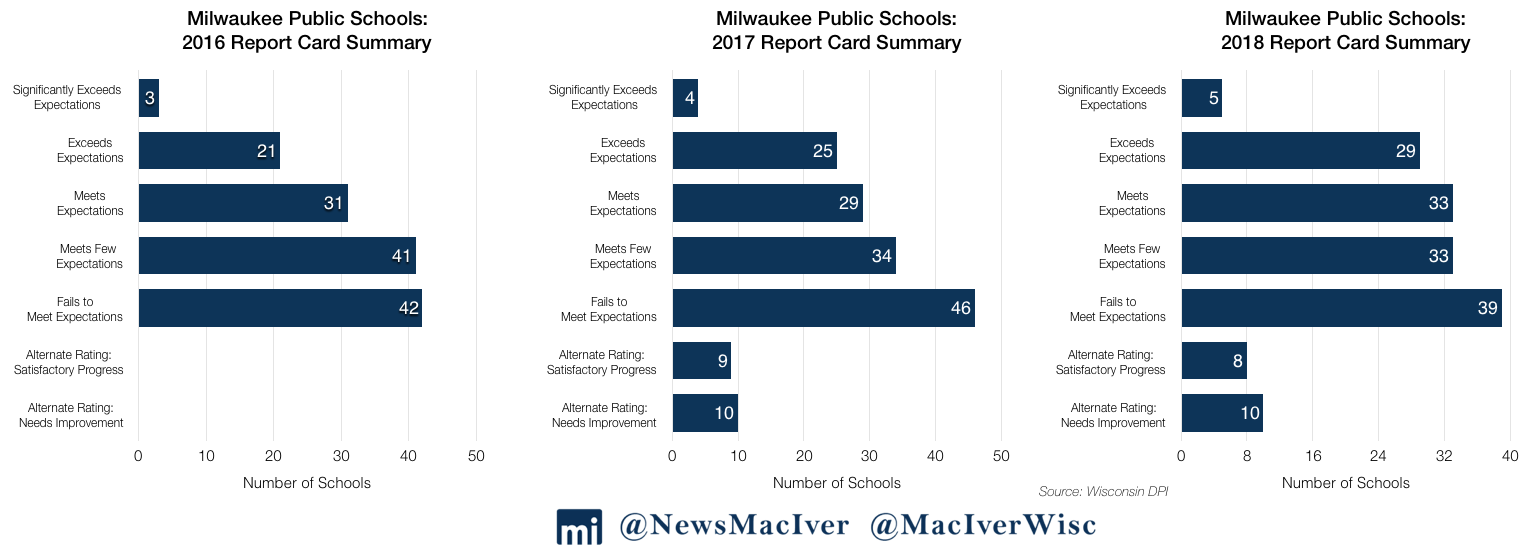
Five MPS schools earned five-star ratings, an improvement from last year’s four schools at that level. More schools also earned four- and three-star ratings, showing slow upward movement in individual school achievement across the district. In all, 139 MPS schools received scores on the five-star scale.
According to the report cards, 20,893 students attend 34 schools in the top two categories. That’s a 20 percent increase in student enrollment in four-star and five-star schools from 2017.
In all, 22,446 students attend MPS’ 39 failing schools. The number of students attending failing MPS schools fell by a full 10 percent compared to last year.
Last year, 46 MPS schools earned failing grades. That number fell to 39 schools this year, or 28 percent of the district’s schools. In all, 22,446 students attend MPS’ 39 failing schools. The number of students enrolled in failing schools fell by 10 percent from last year.
The fact that 10 percent fewer MPS students attend failing schools is undoubtably a good thing. Still, there are more students attending these schools than the entire population of the city of South Milwaukee. Across the state, 40,919 students attend failing schools, with 55 percent of them at MPS. The district is trending in the right direction, but with overall achievement low, challenges still lie ahead.
In scholastic achievement, the district scored 34.1 points. Student proficiency was nearly flat, improving by 0.6 percentage points in math and falling by 1.2 percentage points in English. The report cards show that this year, 15.7 percent of MPS students are proficient in math and 19.2 percent are proficient in English. Proficiency figures are largely based on the spring 2018 administration of the Forward Exam, which we wrote about here.
At twelve MPS schools, there were no students proficient in math or English. Those schools did not receive standard state report card grades, instead using the alternate rating process. That is a self-evaluation of the school’s performance on student achievement in English and math. Seven of the twelve schools reported they are making satisfactory progress, while the other five say they need improvement.
At twelve MPS schools, there were no students proficient in math or English. 55 percent of students attending failing schools statewide are at MPS.
North Division High has the lowest scholastic achievement score in MPS, at just 7.2 points. Even after weighting the score, the school only got a 22.5 overall accountability score and a one-star rating. Only 1.4 percent of its students are proficient in math and 2.1 percent are proficient in English. Last year, zero students were proficient in math, and 7.5 percent were proficient in English.
Auer Avenue Elementary came in next with an overall accountability score of 46.8 points. Even though that’s more than double North Division’s, Auer’s achievement score was only slightly better at 8.2 percent.
Five schools in MPS received a five-star rating of “significantly exceeds expectations.” However, their actual achievement scores leave much to be desired, ranging from 46 to 70.2 percent.
As a district, MPS scored 62 points on its “closing gaps score,” and 62.2 on its growth score.
As we’ve written in the past, the formula for rating schools has changed in recent years. Schools with higher levels of poverty weigh student growth more heavily than achievement. This has resulted in disconnect between the actual rating and student proficiency, but it’s important to see whether or not students are improving as a mark of their school’s effectiveness.
If schools were evaluated on scholastic achievement alone, 110 of MPS’ 139 schools would receive a one-star rating.
Whittier Elementary is the best school in MPS judging solely by scholastic achievement with a score of 84.6 percent. That would merit a five-star rating, but through weighting, it got bumped down to four stars.
In terms of improvement, MPS had one school with a 100 percent growth rating: Milwaukee Excellence Charter School. It received an overall accountability score of 94.3 points, a five-star rating.
Another MPS school, Milwaukee College Preparatory School on Lloyd Street, had a 100-point “closing gaps score,” which contributed to its 89.7-point overall accountability score and five-star rating despite an achievement score of 60.6.
Racine Unified School District (RUSD)
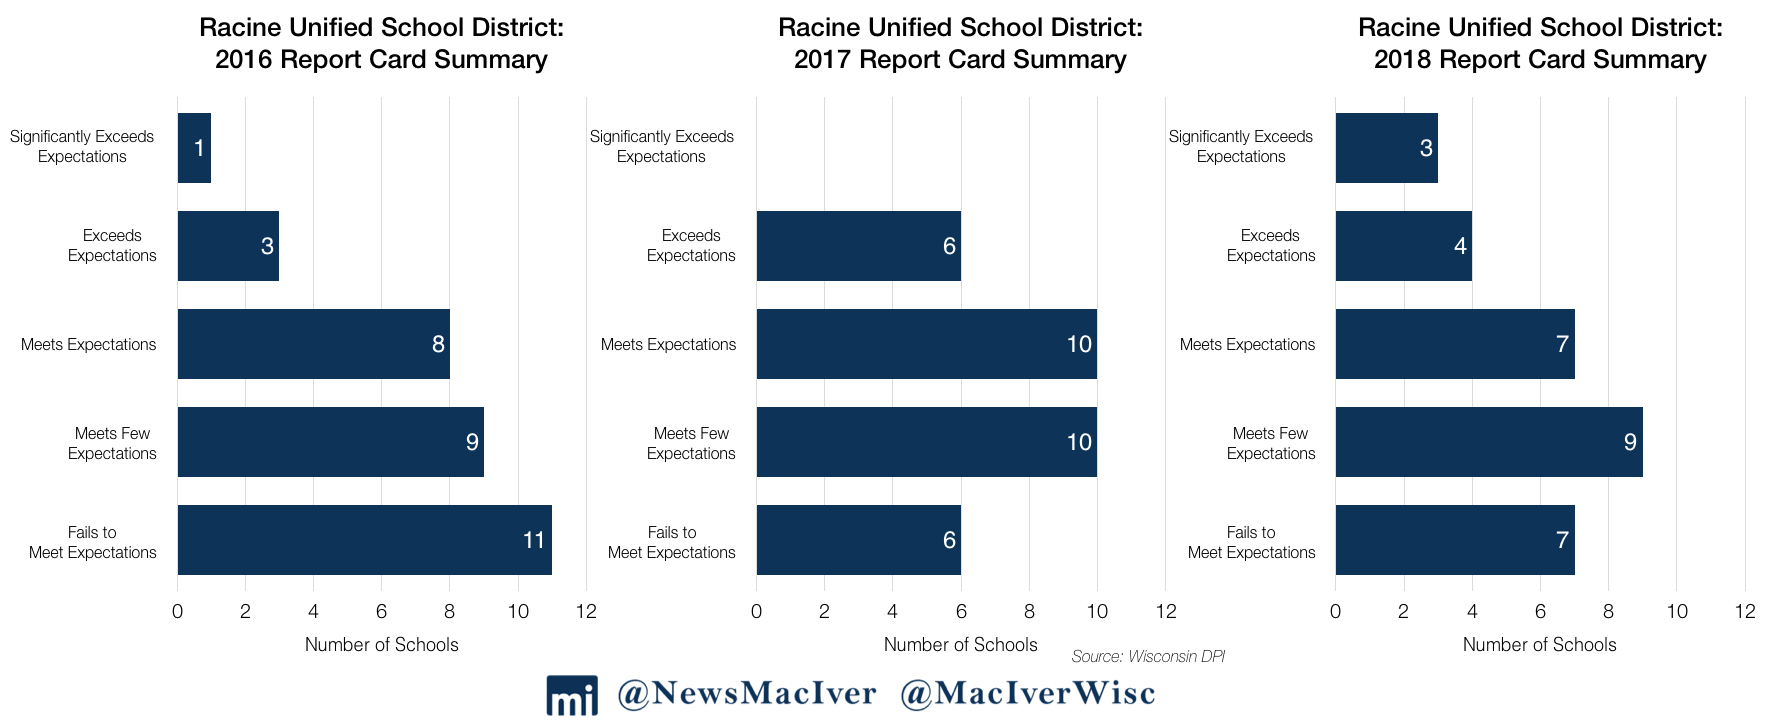
Racine Unified, another historically struggling district, fell from an overall score of 59.3 last year to 58 this year. That makes it a two-star, “meets few expectations,” district.
Two years ago, Racine was a one-star “failing” district with an overall score of 48.1. Although the overall score improved, scholastic achievement has fallen. In 2016, Racine had a 41.2 point achievement score. Last year it dropped to 39.2, and this year it is 38.6.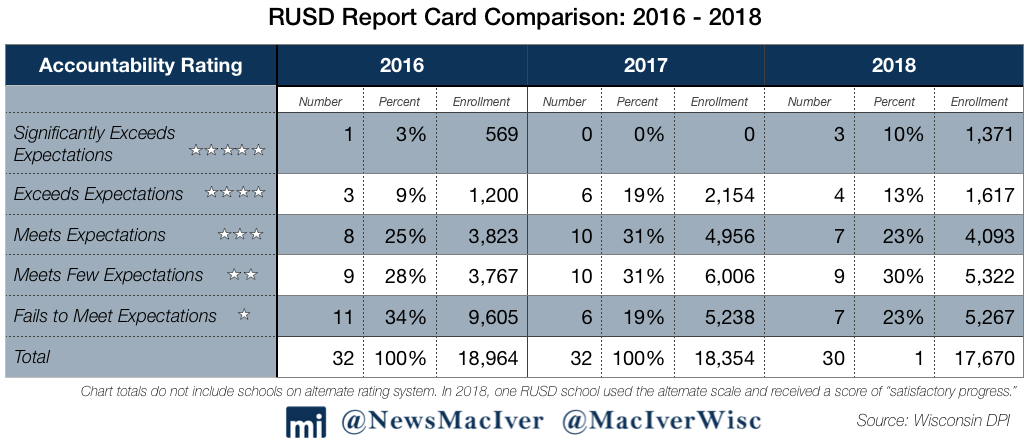
Despite falling achievement, the district has increased its overall score because of student growth, which has increased from 26.1 points in 2016 to 48 points this year.
All together, there are 17,869 students in the Racine Unified School District, and 10,589 go to one or two-star schools. That means 59 percent of students at RUSD attend schools considered failing or meeting few expectations.
Poverty is a challenge in the district, with 64.7 percent of students listed as economically disadvantaged. The school with the highest poverty rate in the district, Janes Elementary, is a five-star school. With an 84.5-point overall accountability score, it stands in stark contrast to Gifford Elementary, which has the lowest poverty rate in the district and an overall score of 65.8.
Parental Choice Programs
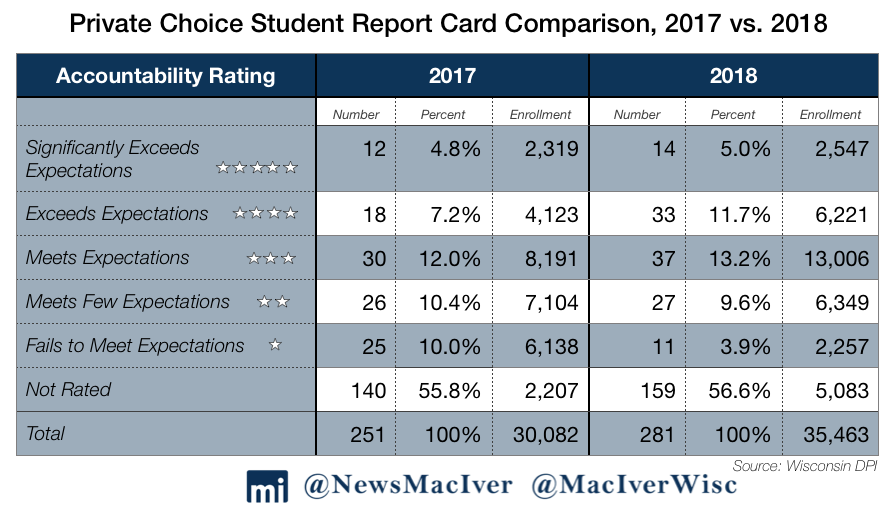
The number of school choice students enrolled in failing schools fell by a stunning 63 percent compared to 2017. The overall enrollment of school choice programs grew by 18 percent in one year.
Compared to last year, students in the private choice programs made strong gains. More schools received five-star ratings, and fewer schools received one-star ratings.
DPI’s report cards identify individual schools as either public, private, and private-choice. Among graded schools, there are 1,910 public schools with a total of 815,978 students, 78 private schools with 24,358 students, and 122 choice schools with 30,380 students.
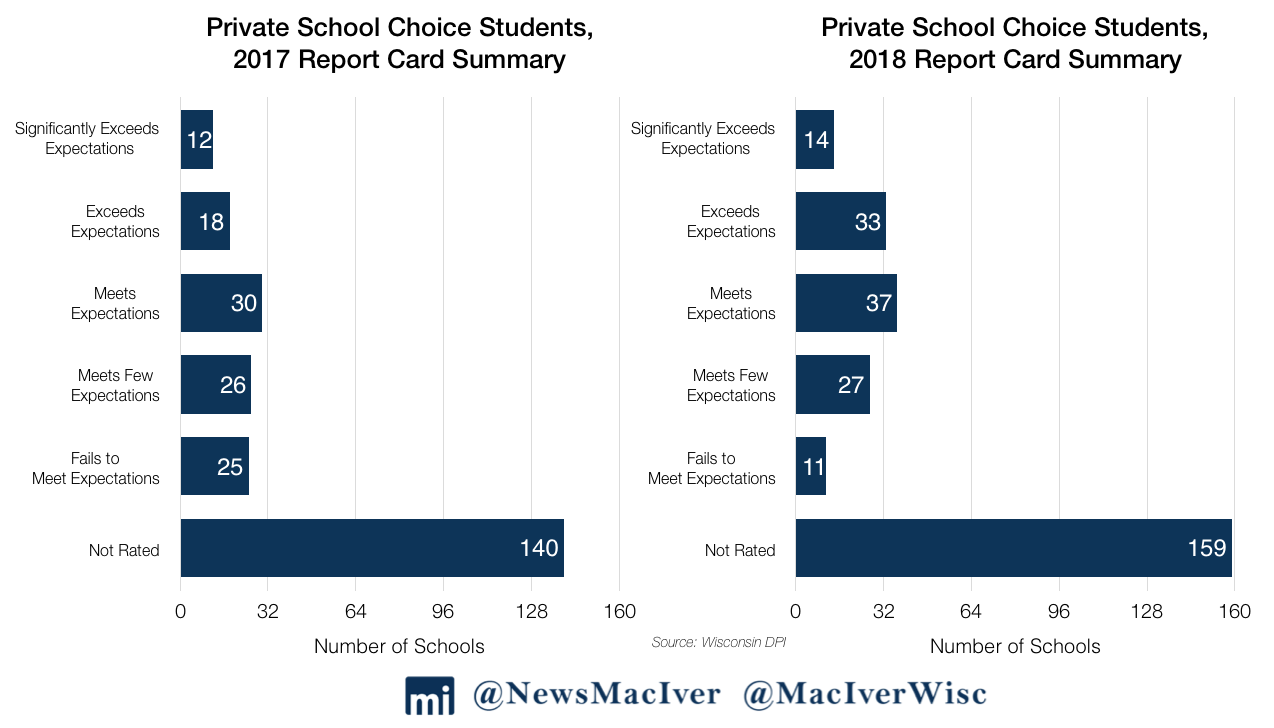
The total number of students enrolled in choice programs increased by 18 percent from 2017, and 30 more schools are participating in the programs. At the same time, the number of school choice students enrolled in failing schools fell by a stunning 63 percent. While 25 private choice schools received just one star last year, this year 11 schools did the same.
A clear upward trend is apparent from last year, which was the first time any choice school received a report card. Two more schools earned top marks, and the number of schools receiving four stars (exceeds expectations) nearly doubled, from 18 to 33. The number of students in rolled in five-, four-, and three-star schools increased by 49 percent from 2017.
On the other side of the achievement scale, the number of students enrolled in two- and one-star schools fell by 35 percent. A sizable number of schools are not rated on the scale, with 159 schools enrolling 5,083 students not receiving an accountability score. Last year, 140 private choice schools were not rated.
Poverty is a determining factor in student achievement. It also runs disproportionately high in private and choice schools, since entry into most of the program is limited to economically disadvantaged students. The average percent of economically disadvantaged students is 40.4 percent in Wisconsin public schools, 62.6 in private schools, and 87.6 percent in choice schools.
Charter Schools
Last year, we called charter schools the shining stars of the report cards. This year, they fared well again, though not quite as strong as the prior year’s growth.
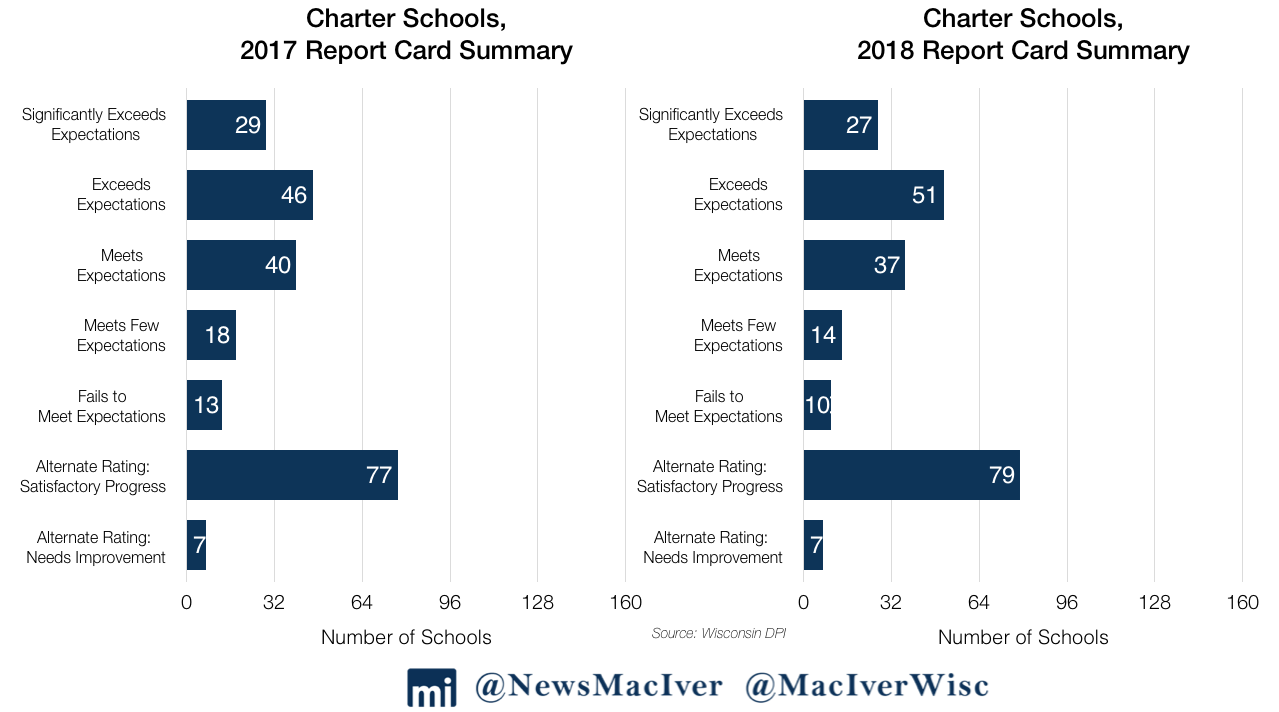
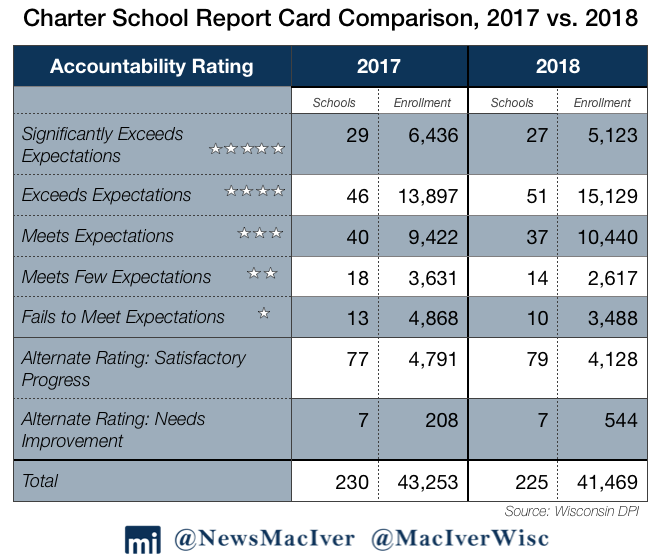
The total number of charter schools receiving report cards fell from 230 to 225, with 41,469 students enrolled. The number of schools earning five stars fell from 29 to 27, while schools earning four stars increased from 46 to 51. In general, more schools seem to be moving towards the middle. Last year, 13 schools earned failing scores and this year, 10 schools did the same.
In all, 30,692 students attend charter schools that earned three-, four-, or five stars. That’s a 3 percent improvement over last year, when 29,755 students attended those schools.
More significant movement occurred at the bottom of the achievement scale. Last year, 8,499 students attended schools earning just one or two stars, while this year, 6,105 students attended those schools. That’s a decline of 28 percent.
Some of the state’s best schools are charters, according to the report cards. Two of the five highest-rated schools in the state are charter schools. Tesla Engineering Charter School, in Appleton, earned a five-star ranking with 97.8 points—the third-best ranked school in the state. Wauwatosa STEM earned 97.7 points, making it the fifth-highest ranked school in the state, according to the ranking metrics.
Five MPS schools earned rankings of “significantly exceeds expectations.” Of those schools, the four highest-ranked schools are charters. Milwaukee Excellence Charter School outranked all other MPS schools with an overall accountability score of 94.3 points. At the school, 31.7 percent of students are proficient in math, lower than the state average of 41 percent but much higher than MPS’ average of 15.7 percent math proficiency this year.
The Best and the Worst
So, with so many different ways to look at success, what is the best district and school in the state?
Hartland-Lakeside J3 makes a strong case for the best district. It has a 96.6-point overall accountability score. That includes a 97.7-point achievement score, a growth score of 100, a closing gaps score of 96, and an on-track score of 93.8.
Identifying the lowest performing district is less clear. Mercer School District has a 55.9-point overall score, the lowest in the state. It is followed by Menominee Indian School District with 56.8 points.
Mercer has an on-track score of 83.9 points compared to Menominee’s 70.9. In Menominee, only 2.8 percent of students are proficient in math and 7.1 percent are proficient in English. In Mercer, 33.3 percent of students are proficient at math and 48.5 percent are proficient in English.
When it comes to actual academic achievement, Mercer comes out head and shoulders above Menominee. Mercer has a 72.1 percent academic achievement score, compared to Menominee’s 19.7 percent.
One final takeaway from the data drop is the clear improvement in the school choice programs. As more private schools begin reporting data to the state, the positive impact of choice is sure to become even more clear—a good thing for public transparency.
Last year was the first that any private schools received report cards, and 12 percent more schools participating in school choice programs got report cards this year. Still, 57 percent of those schools were not rated on the five-star scale because of a lack of data. That number will slowly decrease, and the public will get an even better idea of the success of private school choice, especially in Milwaukee.
—
We hope that you’ve enjoyed this year’s coverage of Wisconsin state report cards. Are you curious about any other achievement metrics or rankings? Let us know in the comments.
