March 27, 2019
By Ola Lisowski
Welcome back to Our Wisconsin!
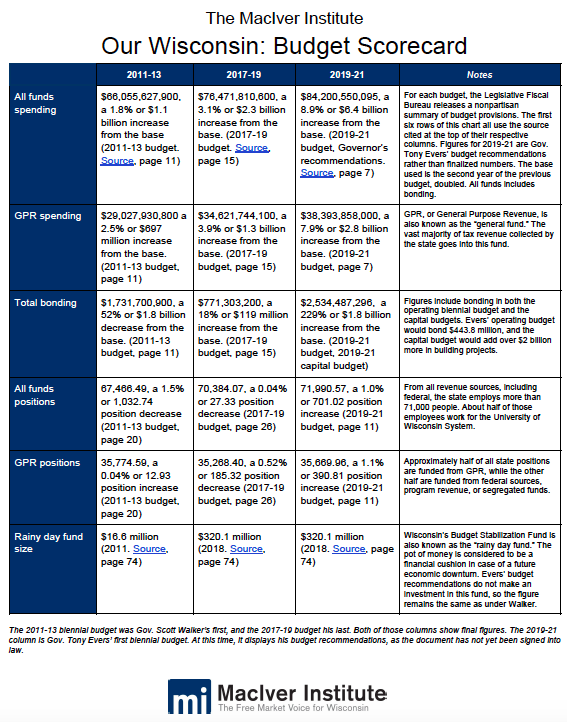
Budget season is officially in full swing. The nonpartisan Legislative Fiscal Bureau (LFB) has completed its thorough analysis of the massive 2019-21 biennial budget. For that reason, we’re coming back to the series Our Wisconsin to release a budget scorecard fully updated with the latest figures you need to know.
Many of the figures in the LFB analysis are different than those in the document published by the Evers administration. Most significantly, total spending in Evers’ budget is more than $710 million higher than the document released by his office last month. In total, his budget proposal spends $84.2 billion over the biennium.
Covering the state budget process is why the MacIver Institute exists. We serve our readers, the taxpayers, by providing in-depth and timely analysis of this massive spending document. Few outlets cover the biennial budget as closely as we do. Even fewer look at the document from a free-market perspective.
Since the budget release on Feb. 28, we’ve published tens of thousands of words analyzing the budget as a whole, followed by deep dives on issues like K-12 education, transportation, health care, higher education, and welfare. In the months to come, watch for our coverage on just about every component of the budget.
The first column of our scorecard focuses on the 2011-13 budget and the second column looks at 2017-19, a direct comparison between Walker’s first budget and his last. The newly-added third column shows spending, bonding, and other important budget metrics in Evers’ first budget proposal. It’s important to note that the bonding rows also include bonding in the capital budget, which funds building projects across the state.
While the cries of austerity and budget cuts have echoed for years, the reality is clear. Wisconsin increased its state spending past inflation by billions of dollars during Walker’s tenure. More people are employed by the state of Wisconsin, and more money is spent every year. During Walker’s tenure, the state borrowed less, and set aside more money for a rainy day.
Evers’ budget ramps up state spending at a much faster rate. Spending increases by more than $7.7 billion in actual dollars. It cuts bonding in the biennial budget, but would add billions more in the capital budget, a separate budget document specific to state building projects.
It’s also important to note the illusion that is Madison Math. As we wrote in our first budget analysis, the budget uses a form of trickery called “base year doubled.” Under that method, the new base for the next budget is simply double the second year in the prior budget. In reality, base year doubled is a sleight of hand trick that guarantees the constant growth of government spending. In this case, the 2017-19 budget spent $76.5 billion actual dollars, but the base year doubled is $77.3 billion. Using base year doubled math provides an automatic incentive to spend more.
In actual dollars, spending increases by more than $7.7 billion since the last budget cycle. But using base year doubled, the increase is $6.4 billion. That’s the official figure used by the state.
In this scorecard, we show actual figures for overall spending. However, we use base year doubled for percent and dollar increases over the prior budget, since those are the figures published by the LFB and are considered the standard for state accounting.
We hope our scorecards will keep the debate and conversation grounded in reality. We hope our scorecards will help you cut through the fog of hyperbole and rhetoric. We hope these scorecards help you decide for yourself: What is the true state of our great state?
Don’t take Evers’ word for it, or any other politician for that matter. Don’t let the media tell you what you should think. Decide for yourself.
Forward, Wisconsin.


