March 18, 2021
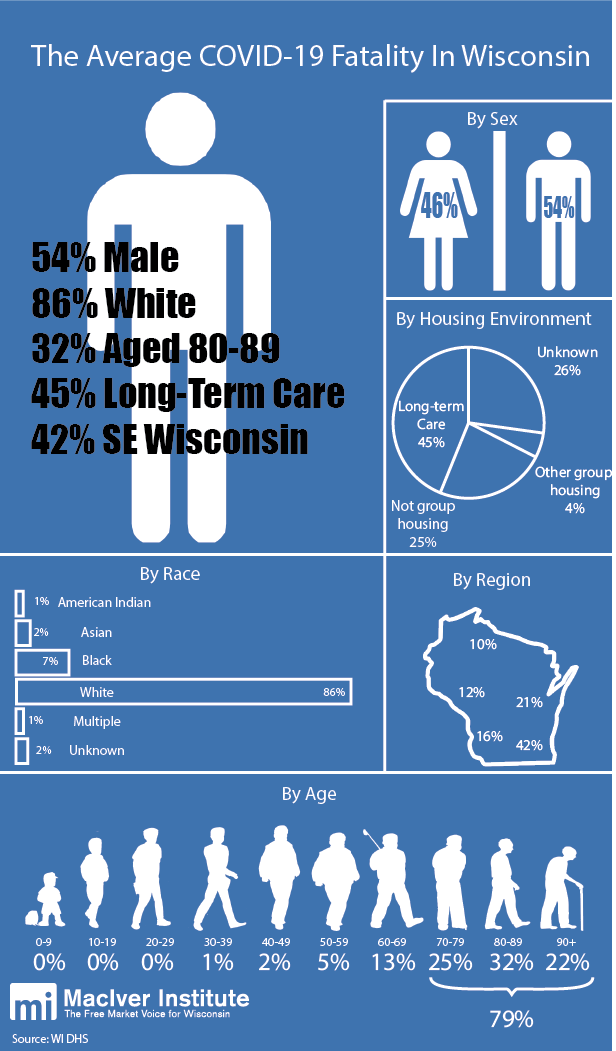
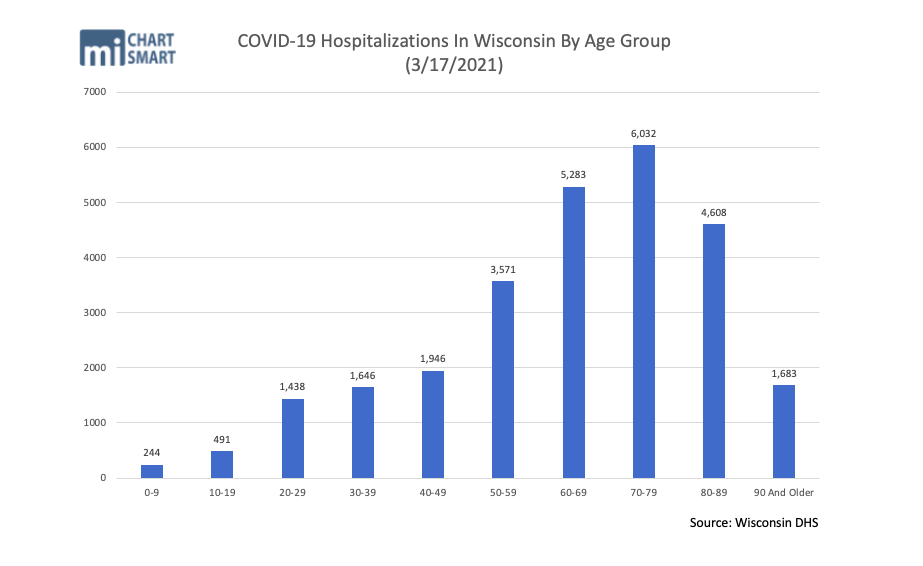
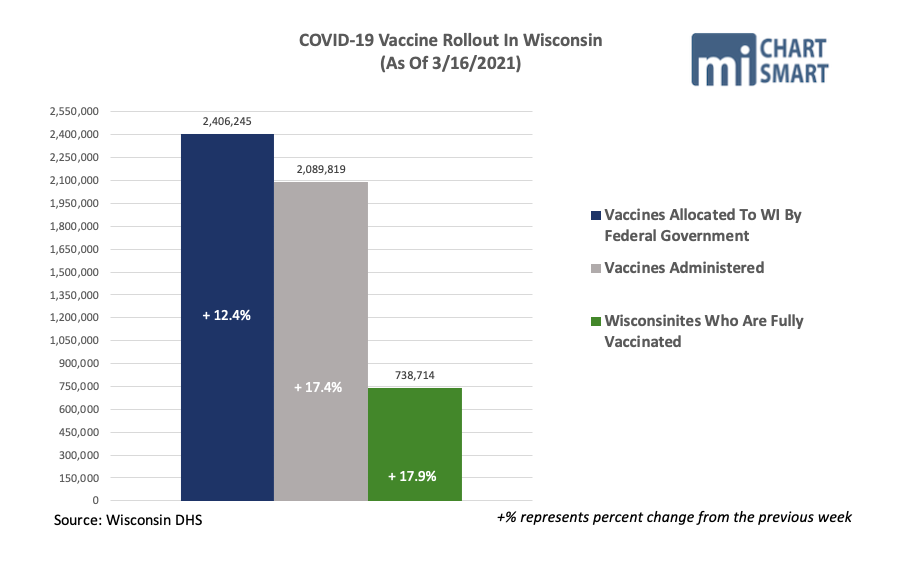
Every week, we update the graphics below. They represent the profile of the average person who has died of the coronavirus in Wisconsin, COVID-19 hospitalizations by inpatient’s age group, and the rollout of the COVID-19 vaccine in Wisconsin. Check back every Thursday so you are always up to date.
NOTE: Starting March 18, our chart on the average COVID-19 death reflects new data from DHS, which shows that 45% of COVID deaths in Wisconsin occurred among people who lived in long-term care facilities.
NOTE: Readers have asked us about death from COVID-19 v. death with COVID-19. Unfortunately, our comparisons do not differentiate between the two. We have asked DHS for data that would help us determine how many people have died of COVID-19 v. how many people have died with COVID-19. Once we have received this data from DHS, we will update our charts accordingly.
Click on each image to open it up with high resolution in a new tab.


