May 30, 2024
By Michael Lucas
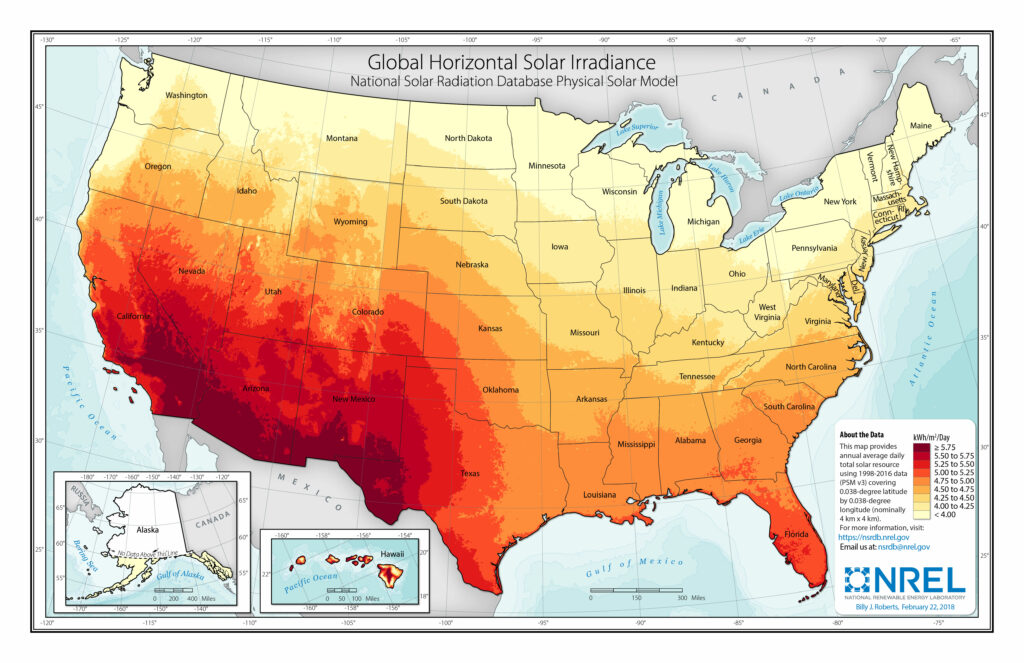
Due to its northern latitude Wisconsin is one of the worst states in the U.S. with respect to solar energy availability. The National Renewable Energy Laboratory reports that roughly 80% of Wisconsin receives less than 4 kWh of energy from the sun per square meter per day (kWh/m^2/day) over the course of a year, and 100% of the state receives less than that for six months out of the year.
As compared to more southern regions with little cloud coverage—Arizona, New Mexico and southern California—the availability of solar energy in Wisconsin is far from ideal. Yet, in 2023 Wisconsin had 612 MW of solar capacity which has since more than doubled to 1,400MW as of March 2024, with plans to build another 650 MW by the end of this year.
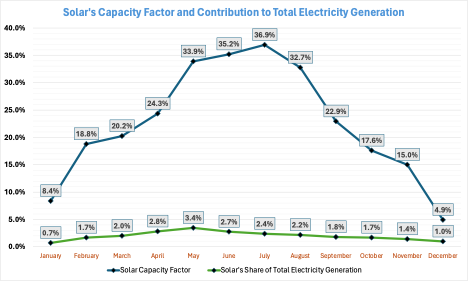
As of March 2024, there are roughly 30 utility-scale solar farms in operation in the state, ranging from 4 to 300 MW of capacity. Together, these farms consist of more than 4 million solar panels and occupy roughly 11,000 acres of land. But despite the already substantial amount of solar capacity present in Wisconsin, in 2023 solar generated less than 2% of the state’s electricity and had an annual capacity factor of 21%.
The 1st Problem with Solar
Solar’s capacity factor. The capacity factor of solar requires many orders of magnitude more solar panels than are currently in place to generate the state’s electricity.
I collected data from each of the Investor Owned Utilities’ websites to see how many panels, acres and MW of installed capacity there were for each solar farm.
On average, a single solar farm in Wisconsin has an average capacity of 70MW and utilizes approximately 200,000 panels and 600 acres—roughly 7.7 acres/MW and 3000 panels/MW of installed capacity. If solar were to fully replace all 15,600MW of power-generating capacity in the state, a one-to-one replacement would require more than 46 million solar panels on 120,000 acres (.34% of Wisconsin). However, these estimates drastically understate the real requirement.
If we adjust for Solar’s annual contribution to electricity generation (less than 2%) in 2023, Wisconsin will require 50 times more solar capacity than existed in 2023; i.e. approximately 92 million solar panels on 235,000 acres (.67% of Wisconsin). But these estimates are unrealistic as well. Solar’s capacity factor in December was only 5% and in January contributed only .7% of the state’s electricity. This means solar must be overbuilt by a factor of 100 to account for just this one month.
In that case, Wisconsin will require 183 million panels on 471,000 acres (1.34% of the state). In the other months where Solar’s capacity factor is higher and panels are generating excess electricity, Wisconsin utilities could sell their excess electricity to other states provided they needed it—otherwise, the panels would have to sit idle so as not to overload the grid. But even if we assume that Wisconsin utilities build enough solar to meet electricity demand throughout the day, there is the inevitable problem of nighttime electricity demand. A 100% solar requirement entails a reliance on either the interstate purchase of electricity (which would not necessarily be “green” or “renewable”), massive buildouts of battery capacity to store excess electricity or both (more on battery capacity later).
While these numbers are unlikely to materialize in the real world, the point of showing this extreme scenario is to demonstrate the resource requirements of a 100% solar policy. For those who advocate for a 100% renewable mix, they will have to contend with the fact that huge portions of the state will need to be dedicated purely to power generation and the impact that this will have on local wildlife and their ecosystems, as well as the amount of farmland that will have to be converted.
As a point of comparison, Wisconsin’s one nuclear power plant has two nuclear reactors on 70 acres generating 13% of the state’s electricity. If instead of solar Wisconsin were to go 100% nuclear, it would require approximately 15 reactors across 8 power plants, utilizing a total of 560 acres. In terms of land usage, a 100% nuclear energy mix is eminently superior, albeit not necessarily economically superior (Read section: The Green Giant, for more on nuclear energy).
The 2nd Problem with Solar
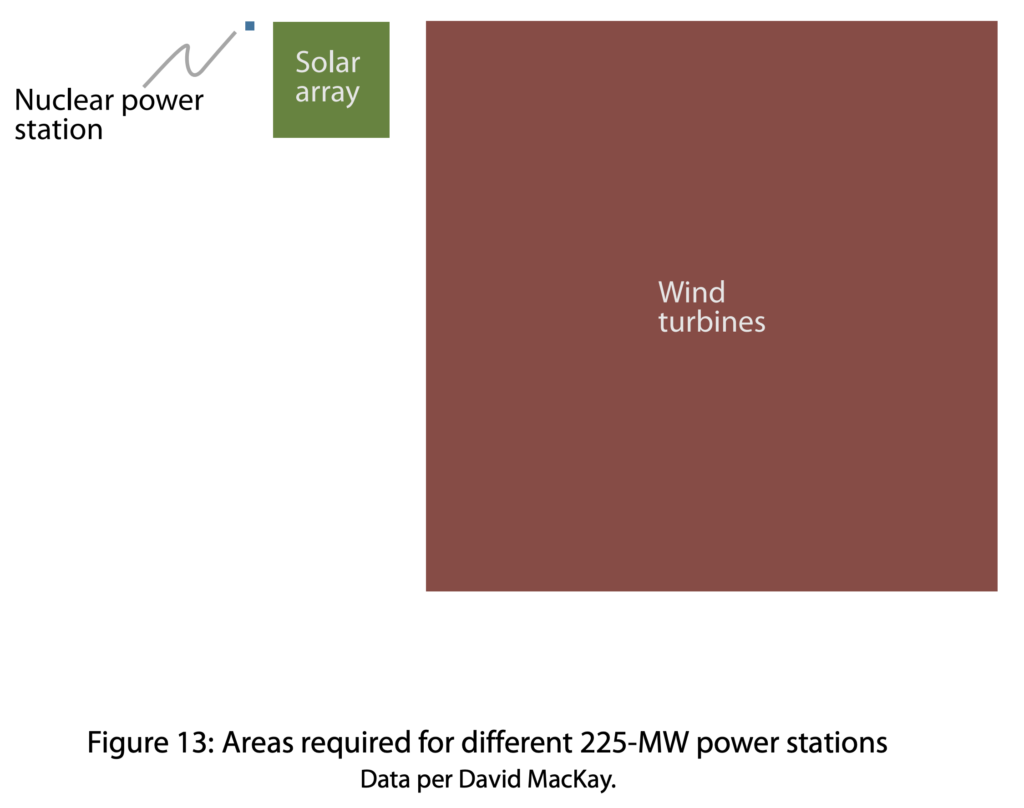
Land usage. The figure above compares the land use requirements of nuclear, solar and wind farms with 225 MW of capacity. A 225 MW solar farm would require 160 times more land than a nuclear facility, and a wind farm would require 4,000 times more. These numbers are particular to the United Kingdom and thus inexact, although the relationship still holds in Wisconsin.
If, instead, we use the figures from the preceding paragraphs, we discover that in Wisconsin solar generation would require 840 times more land than nuclear. The question to be asked in this regard is whether the implementation of solar (or wind) is worth the cost of reduced land availability.
The inevitable clearing of land to build out solar farms would entail a huge cost in terms of Wisconsin’s ecosystems—displacing animals, destroying vegetation, and reducing the bioactivity of soil. These sorts of costs are not considered in the conversation surrounding solar and renewable energy, but they are incredibly poignant questions to ask—especially when it would entail building solar in an area as large as the Greater Milwaukee area.
The 3rd Problem with Solar
The cost. Research conducted by the Center of the American Experiment (CAE) in 2022 reports the cost of solar in Governor Evers’s “net-zero” plan is more than $320/MWh, making it the most expensive source of energy by a large margin. If we compare the costs of the various energy sources utilized in Wisconsin to generate electricity, the real cost of renewables becomes anything but reassuring to consumers.
In 2022, coal power cost $63/MWh (6.3¢/kWh), natural gas $64 (6.4¢/kWh), wind $280 (28¢/kWh) and solar $320 (32¢/kWh). The reason for this dramatic disparity in cost is two-fold: first, solar must be overbuilt to accommodate for its low capacity factor—this means capital costs are many times higher than they would be if Solar’s capacity factor were 100%, and the sheer area occupied by panels means that more transmission lines must be built to connect them to the grid; second, new solar is not depreciated. Utilities are entitled to a rate of return on the present value of all utility infrastructure. This, in combination with its low capacity factor, is the principal reason solar is more expensive than wind, natural gas and coal.
Alternatively, we can also estimate the cost of going 100% solar in Wisconsin by using the estimates provided by WEC Energy Group in their Investor Update where 1MW of solar capacity costs $1.7 million.
In July and November of 2023, utility companies had 612MW of solar capacity which generated 2% and 1.3% of all monthly electricity, respectively. When Solar’s capacity factor is at its highest in July, Wisconsin would need 50 times more solar capacity to produce all the state’s electricity—a cost of $51 billion. In the winter, Wisconsin would need at least 77 times more solar capacity—a cost of $79 billion.
Let’s assume that $50 billion is the total cost to build and hookup solar to the grid. To determine the profits earned by IOUs, then, we can use the typical authorized rate of return of 9.8%. Since the $50 billion cost represents the present value of the utilities’ electricity-generating infrastructure, utilities would be entitled to earn $2.7 billion in profits their first year. Total costs, then, would be approximately $54 billion.
With 3.2 million electricity customers in the state consuming an average of 59 kWh of electricity per day, the one-time average cost of one kWh of electricity would be 78¢. But the average electricity rate in Wisconsin in 2023 was 12.59¢, meaning average electricity rates would increase by more than 6-fold if solar energy were to become the only source of electricity generation. Even in the incredibly generous case where 1MW of solar capacity costs only $1 million, average electricity rates would be 46¢/kWh—3.6 times higher than in 2023.
Whatever the true cost of solar is—whether it be 32¢/kWh, 46¢/kWh or $78¢/kWh—it is an unnecessary cost. Wisconsin already has available to it 13,636 MW of fossil-fueled electric generating capacity (84% of all generating capacity) that is operable, reliable and depreciated or depreciating. This makes them far more economically viable than solar and other renewables.
Of course, critics will object that once solar and wind plants are depreciated that consumers’ electric rates will fall. This is true but does not address the fact that even if utilities were not allowed to earn a profit on new wind and solar, solar would still cost between 28 and 78¢/kWh. Neither does this objection address the fact that wind and solar have considerably shorter lifespans than their coal and natural gas counterparts.
The lifespan of coal-powered power plants is typically reported to be 40-50 years, but this tells us only how long they remain in operation, not how long they can last. This is the difference between a plant’s operating lifespan and its useful lifespan. Of the 324 coal-powered generators (not plants) in operation in the United States, half of these have been in operation since at least 1977 and 15% have been in operation since at least 1960. That’s a useful lifespan of 65 years—not 40.
On the other hand, solar has a useful lifespan of either 25-30 years or 30-35 years while the inverters (component that converts DC to AC power) on solar panels last 10-15 years. This ten-to-fifteen-year lifespan turns out to be the most important figure. Why? Because when these inverters fail, utilities can “repower” their solar farms.
The 4th Problem with Solar
Subsidies and repowering. “Repowering” is when a power station is partially or fully replaced to increase its power output. Repowering confers two advantages to utilities: first, when repowering occurs, the monetary value of the power generator goes up because the depreciation of the facility is reduced; second, wind and solar farms are eligible to receive either the Production Tax Credit (PTC) or the Investment Tax Credit (ITC), which subsidize the cost of these farms.
With respect to the first advantage, consider the Fighting Jays Solar Farm in Texas that was destroyed by hail this past March. Acts of nature such as this are beneficial to a utility-owned solar farm. If a $100 million solar farm has depreciated by 20% of its original value and is then destroyed by severe weather, it will be replaced (repowered) at the consumers’ expense, and new, undepreciated solar panels will take their place. For this reason, there exists an incentive to build fragile power generators like solar panels in high-risk areas. Naturally, this increases the cost of electricity for consumers.
Additionally, if a power generator like solar has a short useful lifespan (20-30 years) and its inverters must be replaced every 10-15 years, these provide utilities with the opportunity to replace the dead or dying solar panels with new panels or components to increase their profits. Thus, there is an incentive for utilities to invest disproportionately in renewables like solar.
As for the PTC and ITC tax credits, historically, wind farms have opted to receive the PTC while solar farms have only been eligible to receive the ITC. However, since the Inflation Reduction Act passed, solar farms have become eligible for the PTC, and many solar farms are now opting to receive the PTC.
The ITC is a straightforward subsidy: utility solar projects are eligible to have 30% of the installation costs subtracted from their owed federal income tax. Since IOUs have their costs (including taxes) covered by consumers, the incentive to apply for this credit is pure optics: when a consumer receives their electricity bill at the end of the month, it will be lower than it otherwise would be without the credit. But while the cost of the subsidy does not appear on consumers’ utility bills, it still appears on their federal tax returns.
The PTC, on the other hand, is a particularly lucrative subsidy for utilities. The PTC allows utilities to receive $27.5/MWh for electricity generated from wind and solar for ten years. Since the amount of electricity generated by these sources is decided by nature, wind and solar often produce electricity when it isn’t needed. The result is that excess electricity reduces the wholesale price of electricity.
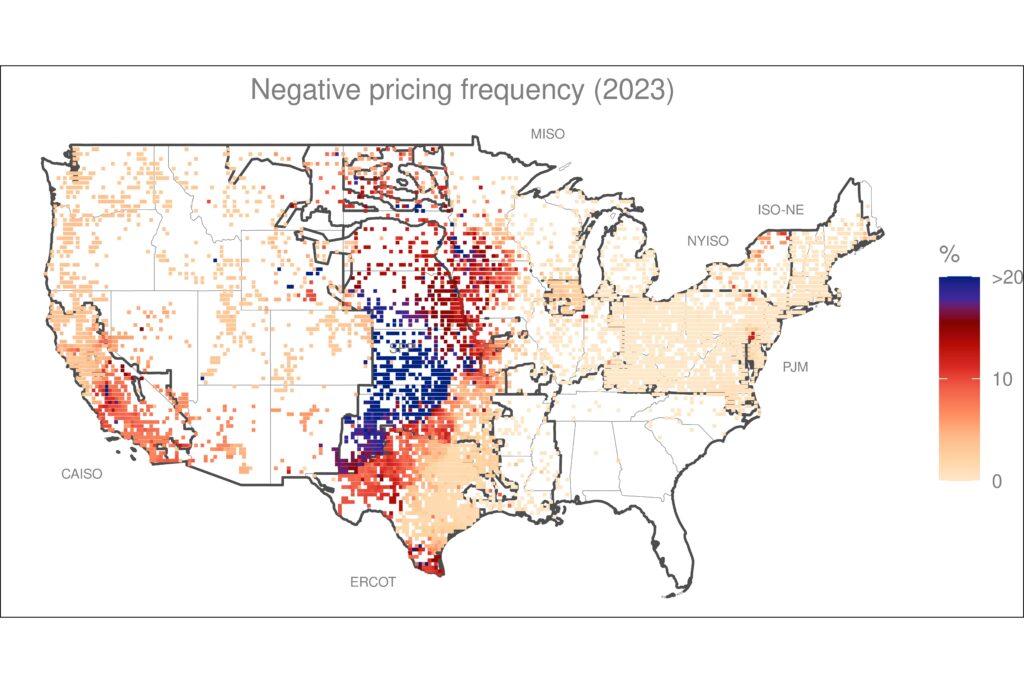
But with the PTC, wind and solar farms can sell their excess electricity at negative prices and still earn a profit. If the price for electricity were -$27.49/MWh wind and solar farms could still earn a 1¢ profit. As Isaac Orr and Mitch Rolling explain, “When prices are negative, coal and nuclear plants are forced to pay other people to take their power because it is difficult for them to scale back their generation quickly.”
This means that a utility that has decided to keep a reliable fossil-fueled energy mix is penalized for being efficient and saving consumers money. The incentive, then, is to be inefficient and build wind and solar. Furthermore, since the PTC expires after ten years, for a utility to requalify for the subsidy they must repower their existing solar developments. Solar and wind thus become incredibly attractive investments.
Incidentally, states with the largest amounts of wind and solar capacity receive the most in subsidies and have the most frequent occurrences of negative prices. They also have higher electricity rates according to a paper by Greenstone and Nath from the University of Chicago: “7 years after the adoption of an RPS (Renewable Portfolio Standard) program…retail electricity prices are 11% higher; 12 years after adoption…[they are] 17% [higher].”
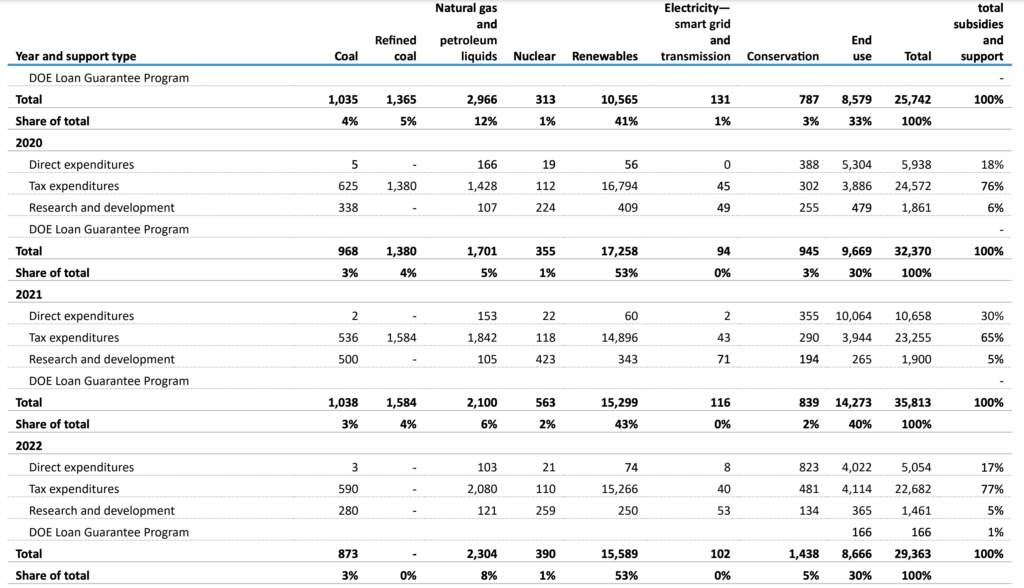
Solar and renewables simply could not exist at their current levels without subsidies. In 2022 renewables received 53% of all federal subsidies; solar alone received 17% of all federal subsidies and wind received 10%.
Conclusion
Solar is an inefficient, expensive and unreliable source of energy. Its low capacity factor means that utilities have to overbuild by at least a factor of 50 to generate all of Wisconsin’s electricity. But even if this were accomplished, solar could do nothing to generate electricity in the evening or in times of inclement weather. It cannot, on its own, provide electricity to Wisconsinites.
A 100% solar grid would also require huge swathes of land covering the entirety of the Greater Milwaukee area—some 470,000 acres. The amount of land required to go 100% solar in Wisconsin could be accomplished by building only eight nuclear power plants on 600 acres. Solar’s environmental impact in terms of ecosystem disruption is a fact that cannot be ignored or considered to be trivial—not when it would occupy more than 1.3% of the state.
Solar is also the most expensive source of energy in Wisconsin by a large margin. Currently, the cost of electricity from solar is five times more expensive than both coal and natural gas power plants. In the extreme, a 100% solar grid would cause average electricity prices to increase from 12.5¢/kWh to 80¢/kWh if not more.
Finally, solar cannot exist without subsidies. Federal tax credits like the PTC and the ITC distort the real cost of solar by shifting the expense from consumers’ utility bills to their tax returns. Additionally, these subsidies encourage utilities to invest in solar for the wrong reasons; incentivizing them to repower solar farms in order to requalify for tax credits and renew their profits.
