Back-to-school season is upon us, which can only mean one thing. No, it is not the return of blissful quiet to your home. It is time for MacIver’s annual State of K-12 Education Report Card.
How do Wisconsin’s students, teachers and schools measure up? Are taxpayers receiving a decent return on their investment?
Nearly 6 in 10 Wisconsin students are NOT proficient in basic math or English – Where is the outrage?
Despite massive funding increases and flat enrollment, troublesome achievement gaps persist and much, much more.
September 3, 2019
A MacIver Institute Analysis by Ola Lisowski
Over 800,000 Wisconsin students are heading back to school this week, which means it’s time for MacIver’s annual State of K-12 Education analysis.
According to the state’s Forward Exam, 6 in 10 Wisconsin students are not proficient English language arts or math.
There are many ways to judge individual academic achievement and overall system-wide educational success. Most Wisconsin students in elementary school take the Forward Exam, while high school students take the ACT and Advanced Placement (AP) exams. The state also tracks success by reporting graduation rates and achievement gaps, culminating in annual school and district report cards. Test scores are important, but they aren’t everything. Does a student have access to the school that best fits their needs? If a student graduates from high school and heads to college, is that student prepared to learn and able to graduate in a timely manner? So many metrics, so little time.
We pour over all of this data and condense it down into an analysis that you can then use to decide for yourself – are Wisconsin’s schoolchildren learning what they need to know to be successful after high school and are the schools doing their job well?
Let’s dive in.
Academic Metrics
Graduation Rates
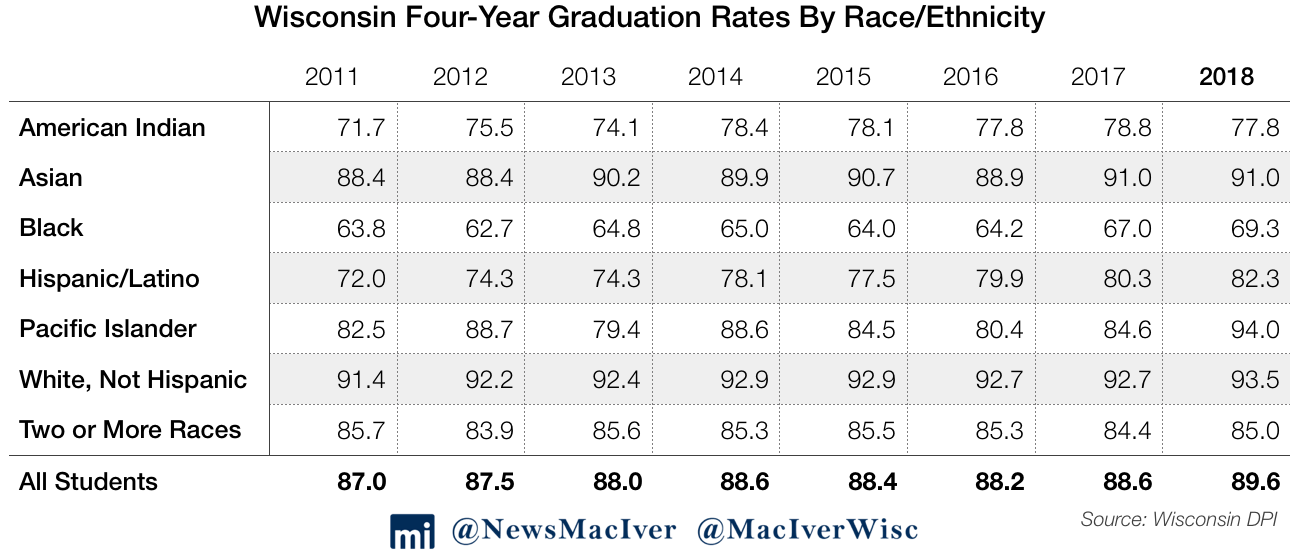
Let’s start with the most common metric used to judge academic success – the rate of graduation from high school. The latest dataset showed that 89.6 percent of Wisconsin’s high school class of 2018 graduated in four years. Students graduated at a slightly higher rate compared to 2017, when 88.6 percent graduated in four years. The figure dipped between 2014 and 2016 but has generally trended upward.
The graduation achievement gap or the diploma gap as it is called between racial and ethnic groups persists, particularly between white and black students. For the class of 2018, 93.5 percent of white non-Hispanic students graduated in four years, while 69.3 percent of black students graduated in the same amount of time — a 24.2-point gap. In 2011, the white-black diploma gap was 27.6 points, meaning the gap has only closed by 3.4 points in seven years.
Hispanic/Latino students have shown the largest graduation achievement improvement of any racial or ethnic group since 2011, when 72.0 percent of students graduated high school in four years. Seven years later, 82.3 percent of Hispanic/Latino students graduate on time, a 10.3-point improvement.
Forward Exam
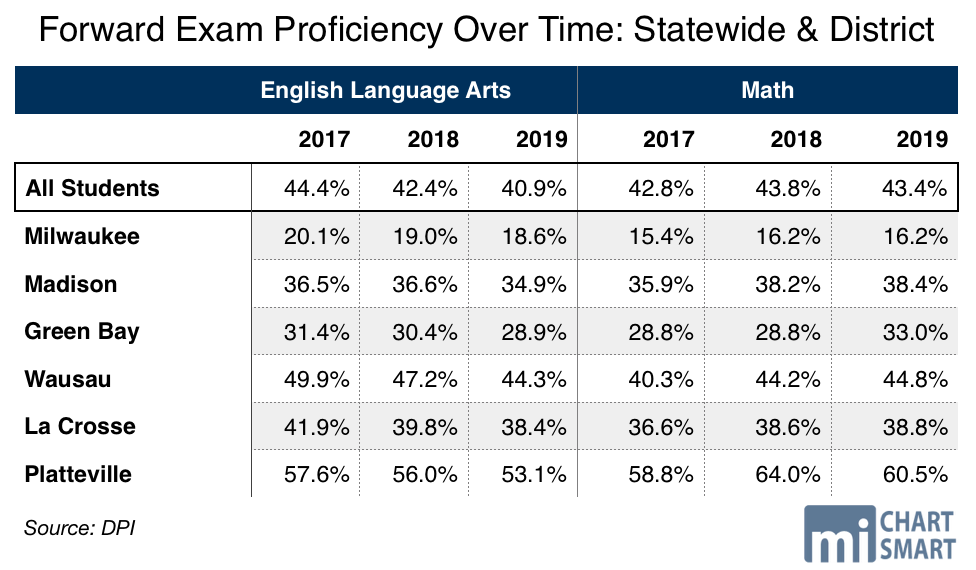
Just four out of ten K-12 students are proficient in math and English language arts, according to new data from Wisconsin’s Department of Public Instruction (DPI). Statewide, only 40.9 percent of all students are proficient or advanced in English language arts, down from 42.4 percent last year. In math, only 43.4 percent of all students show proficiency, a small decrease from last year’s 43.8 percent. According to DPI, a student who rates “proficient” means simply that the student is performing at grade level.
More than one-third of students, 34.4 percent, scored basic on the English languages arts section, while 23.2 percent scored below basic. A larger portion of students received scores of below basic compared to last year, showing a troubling decline in achievement.
In social students, 49 percent of students demonstrated proficiency, down from last year’s proficiency of 50.6 percent. Science results were not reported this year because of a change in tested topics.
The results come from the spring 2019 administration of the Forward Exam, which is the fourth time Wisconsin students have taken the test. Nearly 589,000 students in 3rd through 11th grade took the exam. Participation was 98 percent for public school students, and 90.6 percent for private school choice students.
While 51.8 percent of white students statewide are proficient in math, just 11.6 percent of black students are proficient, totaling a shocking 40.2-point gap. Black students’ math scores improved by a hair, while white students saw a decline in proficiency. Last year’s black-white achievement gap in math was 40.7 points. 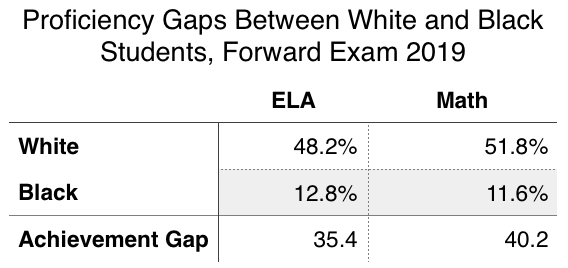
In English language arts, a 35.4-point achievement gap exists for white and black students. Just 12.8 percent of black students are proficient in the subject.
Milwaukee Public Schools (MPS), the state’s largest school district, had average proficiency far below the state average. Just 16.2 percent of MPS students are proficient in math, the same as last year. 18.6 percent of MPS students are proficient in English language arts, a small decline from last year’s 19.0 percent.
Math achievement gaps widened slightly at MPS. Just 9.4 percent of black students are proficient in math, a slight improvement from last year’s 9.1 percent. This year, 39.5 percent of white MPS students showed math proficiency, totaling a black-white achievement gap of 30.1 points, up from last year’s 29.5-point gap.
Students fared a bit better at English language arts, with 45.3 percent of white MPS students proficient and 10.6 percent of black students proficient for a 34.7-point gap. That’s slightly smaller than last year’s 35.3-point gap.
AP Exams
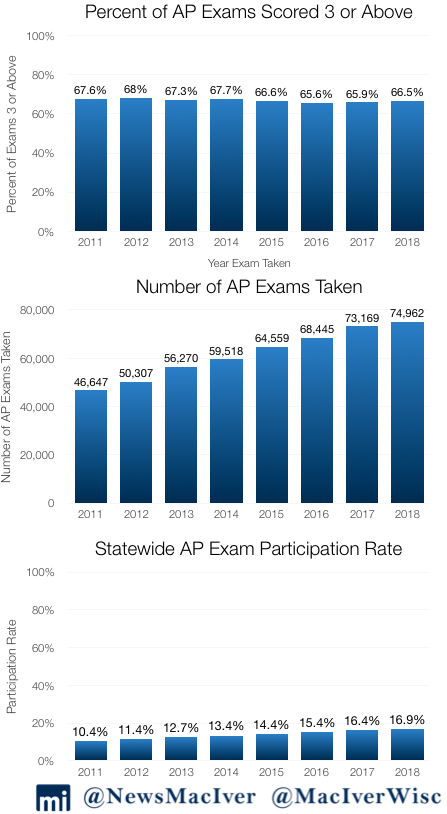 One bright light in the data shows that more high school students are taking Advanced Placement (AP) Exams, and perhaps more significantly, more students are scoring well on those exams. Students with an AP Exam score of three or higher are awarded college credit at many universities, including in the University of Wisconsin System.
Even as the number of exams taken increased by 2.5 percent in one year, scores also continue to increase. Approximately two-thirds, or 66.5 percent, of AP Exams that students took in May 2018 had scores of three or higher. The previous year, 65.9 percent of exams were scored three or better.
The overall participation rate remains low, at 16.9 percent in 2018, but has gradually increased since 2010. In 2017, 16.4 percent of high school students statewide took an AP Exam.
In terms of overall exams taken, Wisconsin students took a stunning 61 percent more AP Exams in 2018 compared to 2010.
Remedial Education
When students enter the University of Wisconsin (UW) System, they must take placement exams for math and English before freshman year begins. If students don’t do well enough on those placement exams, they are required to take remedial classes before beginning regular college coursework.
Remedial education data show the extent to which the K-12 education system is failing students. Rather than demonstrating mastery of material before graduating high school, thousands of students are moving through the system and arriving at college unprepared.
Thousands of students from Wisconsin high schools have to take remedial classes at the UW System every year. In the fall of 2017, these students came from 197 high schools across the state.
The growing trend of required remedial education highlights that students are graduating from high school woefully unprepared and still being accepted into the UW System.
Plus, the issue compounds many other troubling trends. Students take remedial education classes for full tuition and zero credit. The classes do not count towards degree completion, and students must pass them before moving onto regular coursework. The issue plays into the trend of increasingly high levels of student loan debt, and the amount of time it takes college students to earn a degree—if they finish at all.
Studies show that students who take remedial classes in college are also less likely to graduate, leaving them with thousands of dollars in debt without a degree.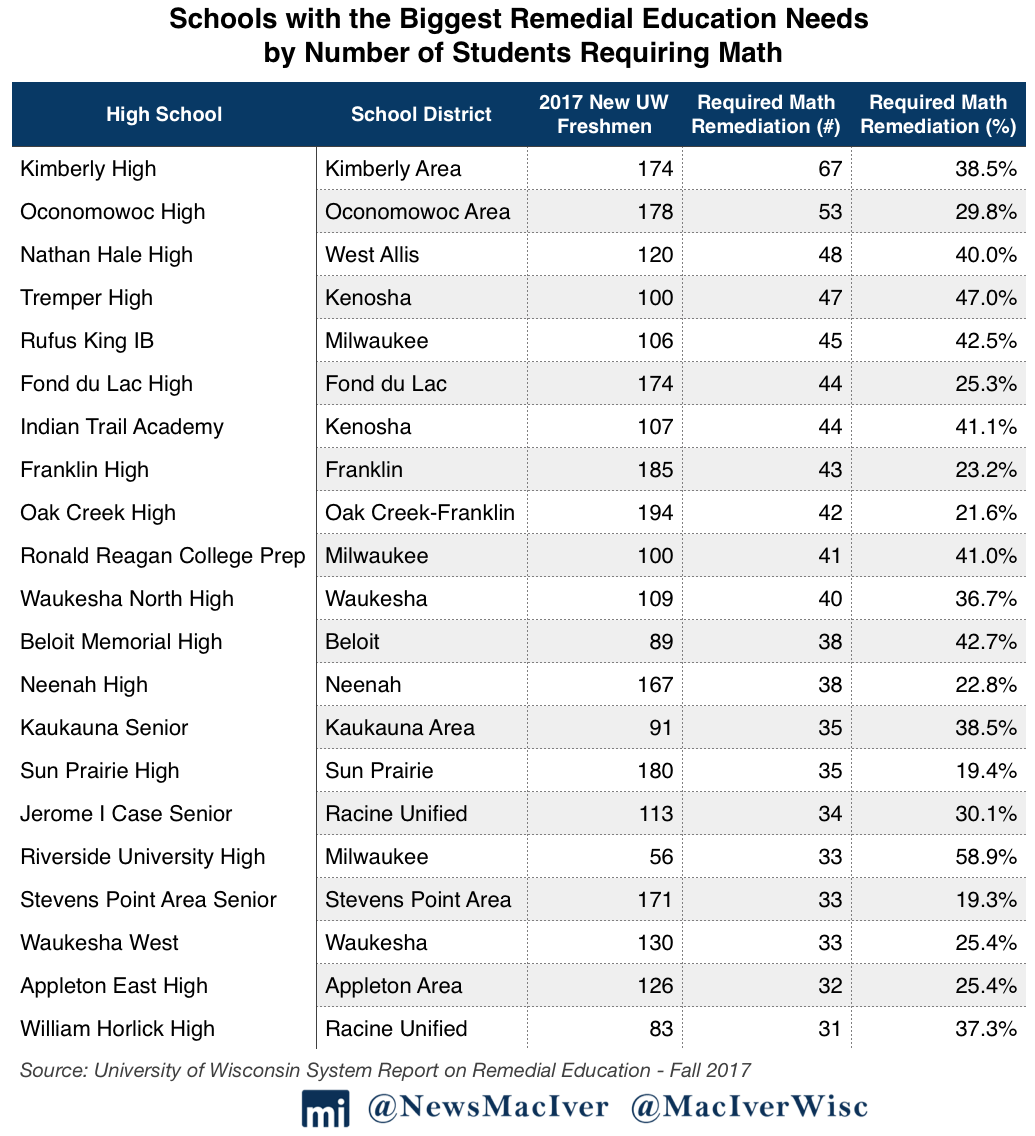
One hundred and eighty-five schools graduated classes where 10 percent or more of the students starting at UW needed remedial math instruction. That’s an uptick from the previous year’s report, which showed that 172 schools graduated classes where 10 percent or more of students needed remediation.
Eleven schools sent classes to UW where 50 percent or more of the students required remedial math. That’s an improvement from 2016, when 15 high schools met that criteria. Of those 11 schools, five are part of the Milwaukee Public Schools district, the largest in the state. At 80 percent, Royall High School had the largest percentage of its graduating class needing math remediation.
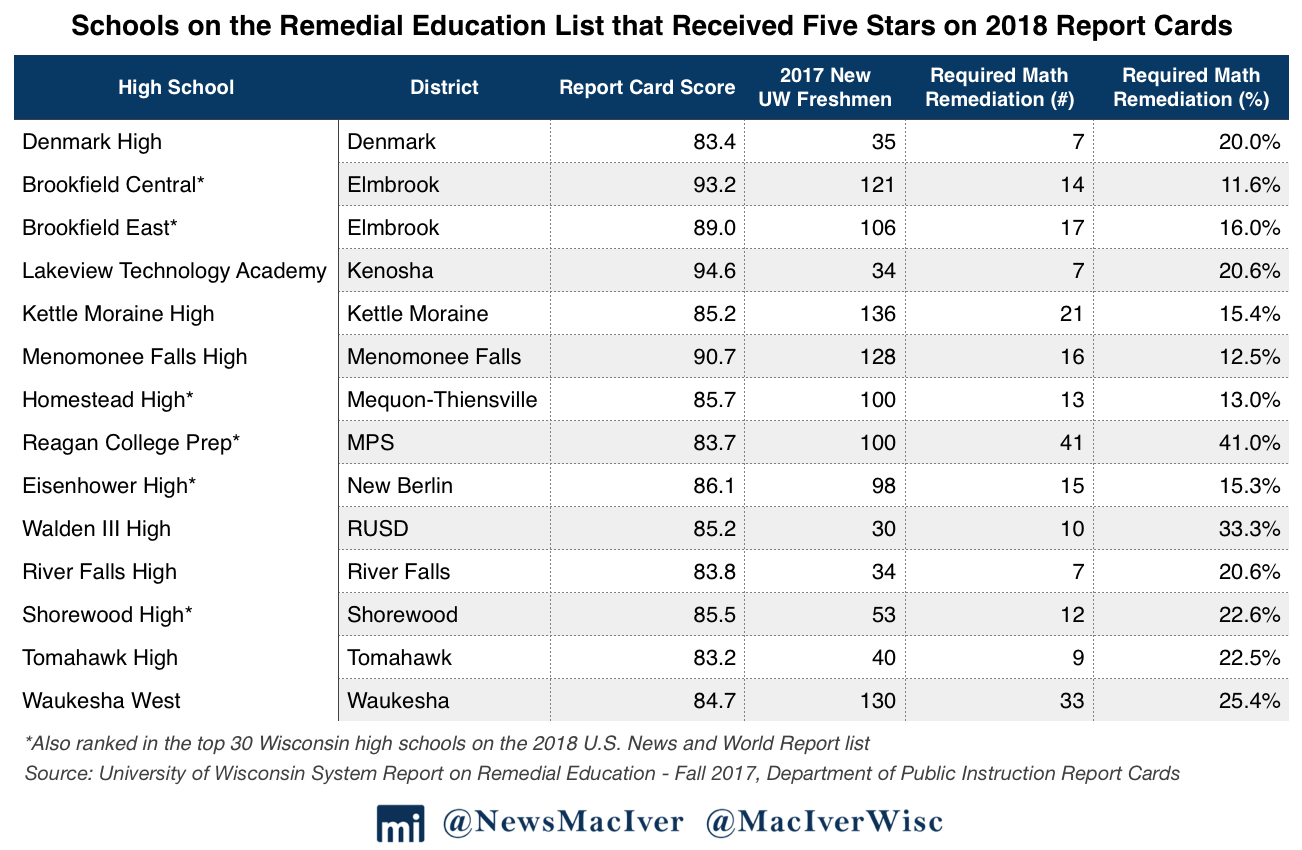
Perhaps most troubling in the remedial education report is that many schools on the list ranked highly on Wisconsin’s own report card system. Fifty percent of the high schools who received five stars on Wisconsin’s 2018 report cards graduated students who needed the remedial classes. On average, Wisconsin’s “best” high schools graduated classes where 21 percent of students who entered the UW System required math remediation. Those 222 students come from all over the state – Brookfield, Tomahawk, Shorewood, Kenosha, Milwaukee, and many others.
Fourteen schools that sent high numbers of unprepared students to the UW System received ranks of five stars, or “significantly exceeds expectations,” on Wisconsin’s 2018 report cards. That’s a significant increase from the prior year’s list, which showed that nine schools with significant remediation needs had received five-star rankings on the most recent report cards.
Others still were included on notable lists such as U.S. News and World Report and are purportedly among the best schools in the state and country. Eisenhower High School in New Berlin was ranked the second-best high school in the state by U.S. News and World Report. Fifteen percent of their graduates going to UW needed remedial math coursework to catch up.
In fact, nine of the ten best high schools in Wisconsin – according to the U.S. News and World Report 2018 rankings – appear on the remedial education list. The only school that does not is the number one-ranked school, Whitefish Bay High. Of the top twenty schools on U.S. News’ list, 17 had issues with math remediation.
Clearly, there is a disconnect between official rankings and student preparedness for life after high school. Students who are told that they attend the best high schools in the state end up behind when they get to the UW, requiring help with basic algebra and trigonometry. It also throws a huge grain of salt on DPI’s biggest data release of the year: annual report cards. On that note…
Report Cards
Wisconsin schools are improving, according to the Department of Public Instruction’s (DPI) annual report cards for 2019. At the same time, district performance is trending downward, with more districts earning three-star and two-star results compared to last year.
The Mercer School District was the only school district in the state to receive to earn one star this year, failing to meet expectations.
Most schools and districts are scored on a 0-100, five-star scale, from “fails to meet expectations” to “significantly exceeds expectations.” A small percentage of districts and schools use alternative accountability measures, receiving scores of either “satisfactory progress” or “needs improvement.” Approximately 9 percent of schools were not rated because of insufficient data.
Compared to 2018, more schools trended upwards, especially at the lowest end of the rankings.
Districts and schools with one star “fail to meet expectations.” Only one district, Mercer School District in Iron County, received one star this year. For the last two years, no districts have earned one star.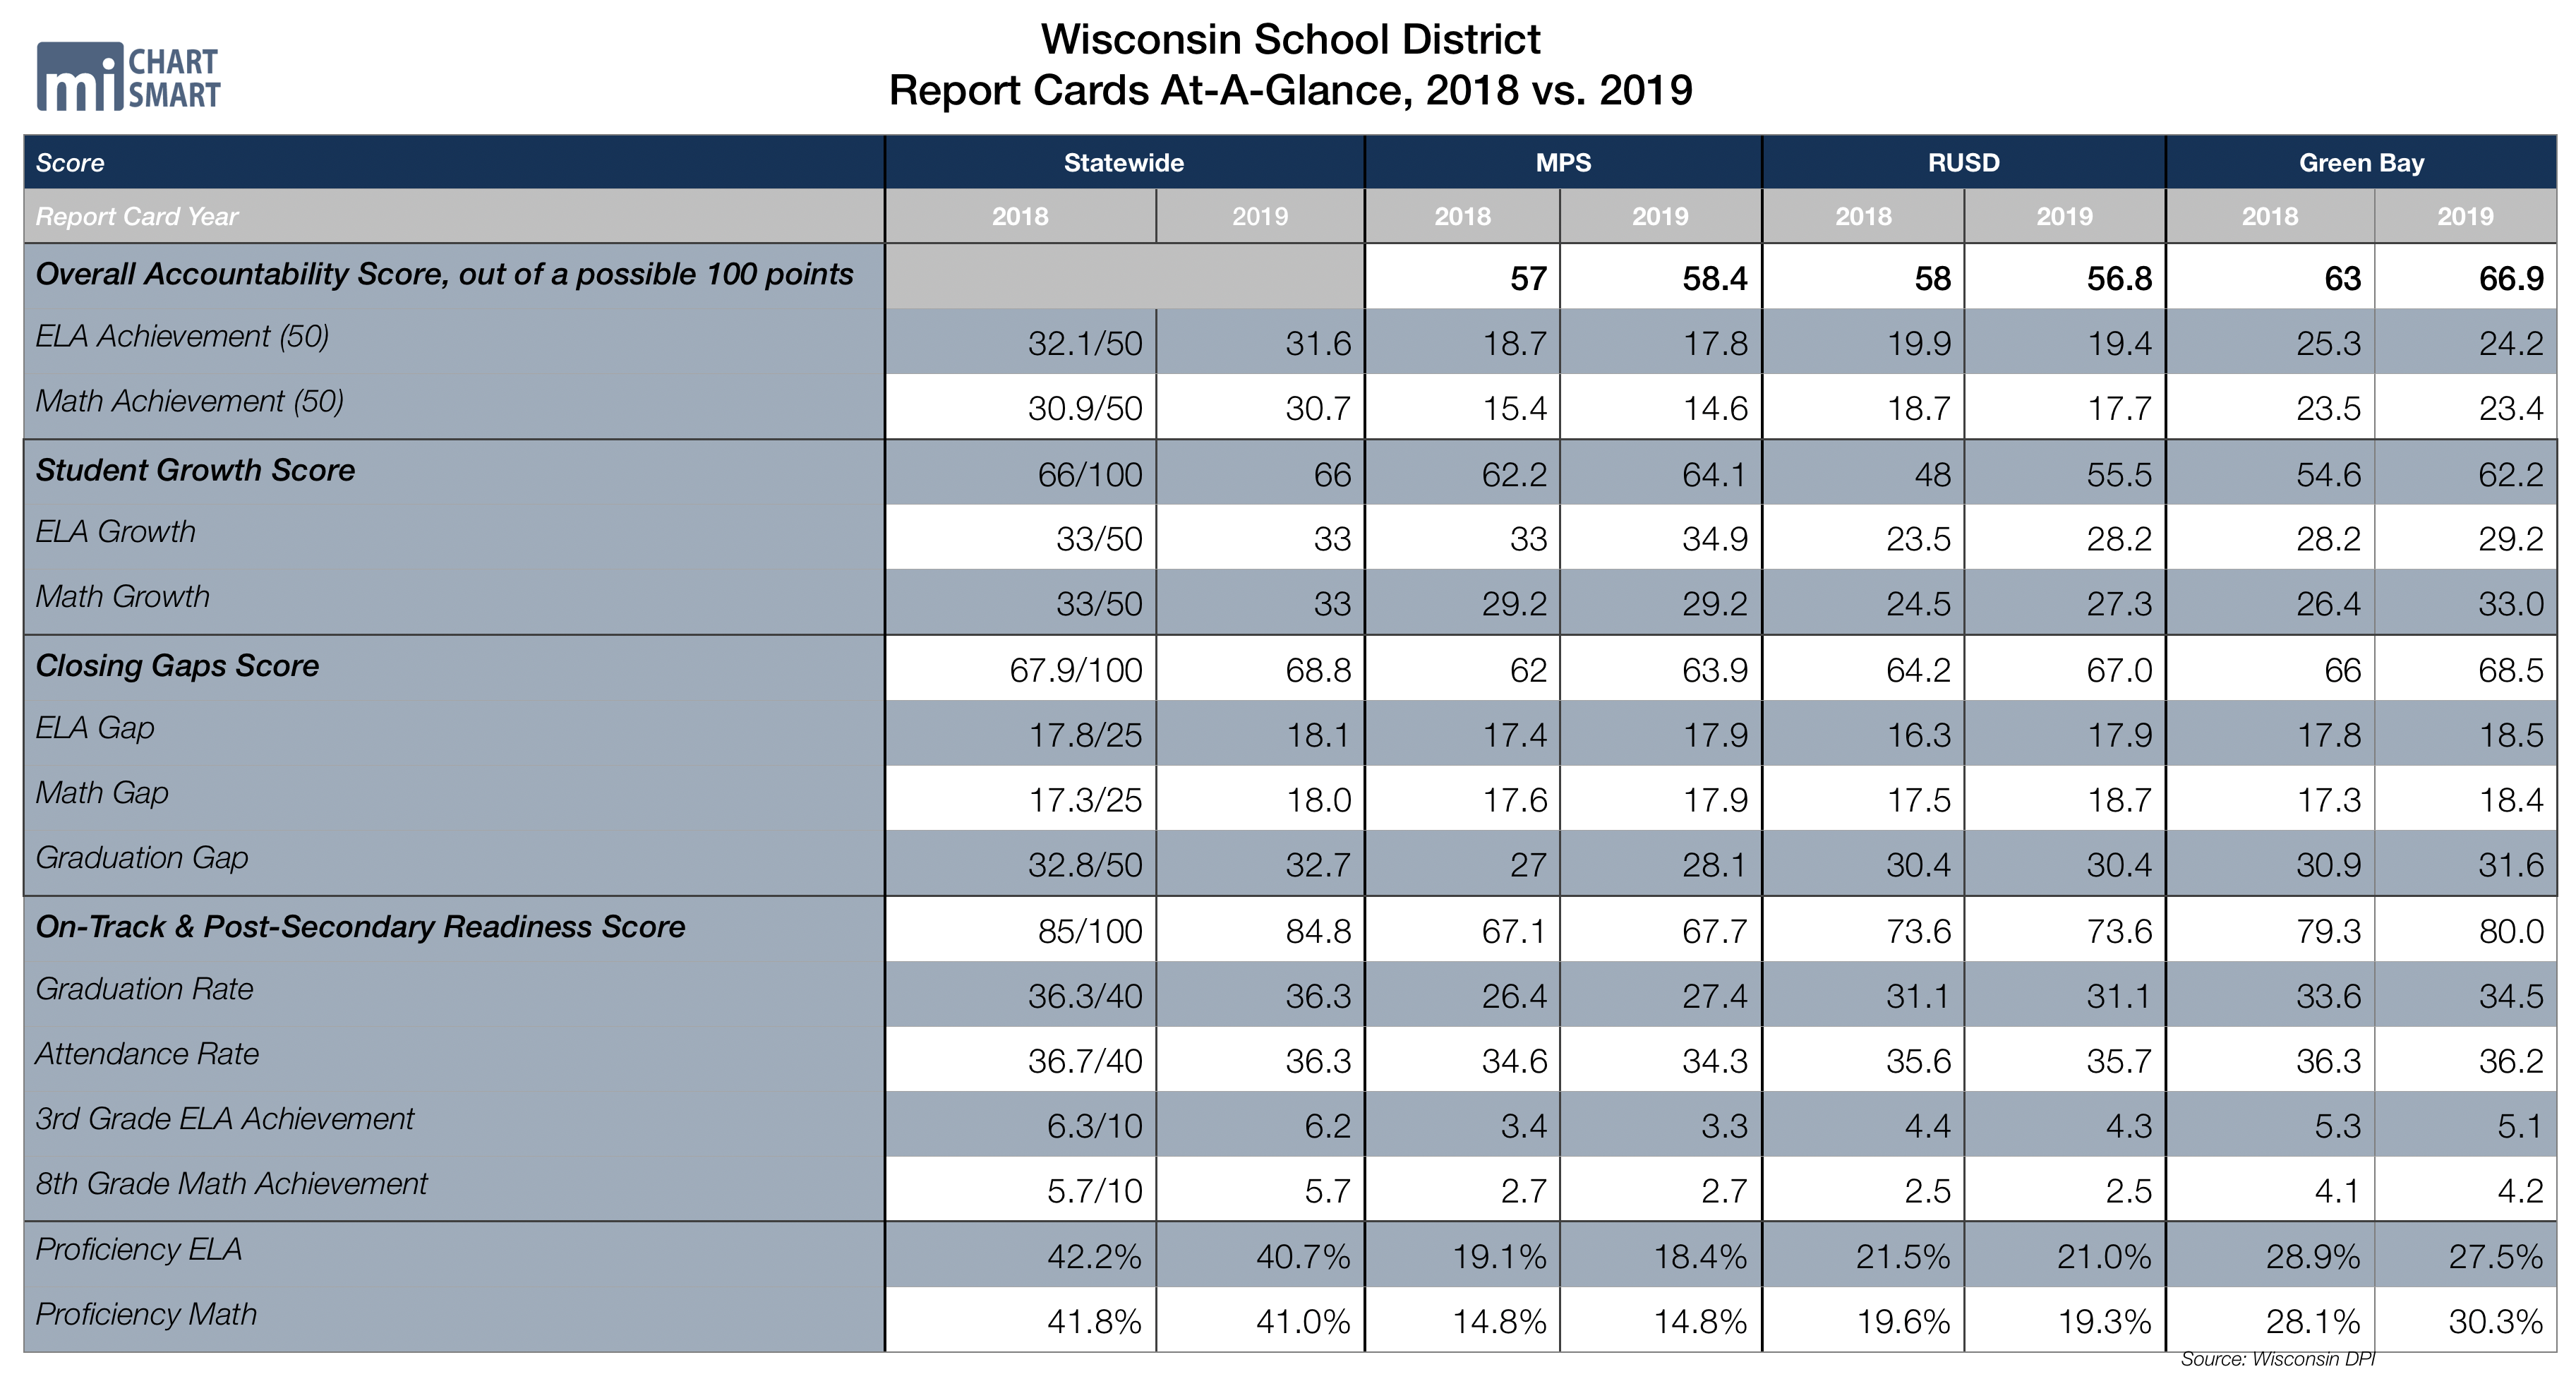
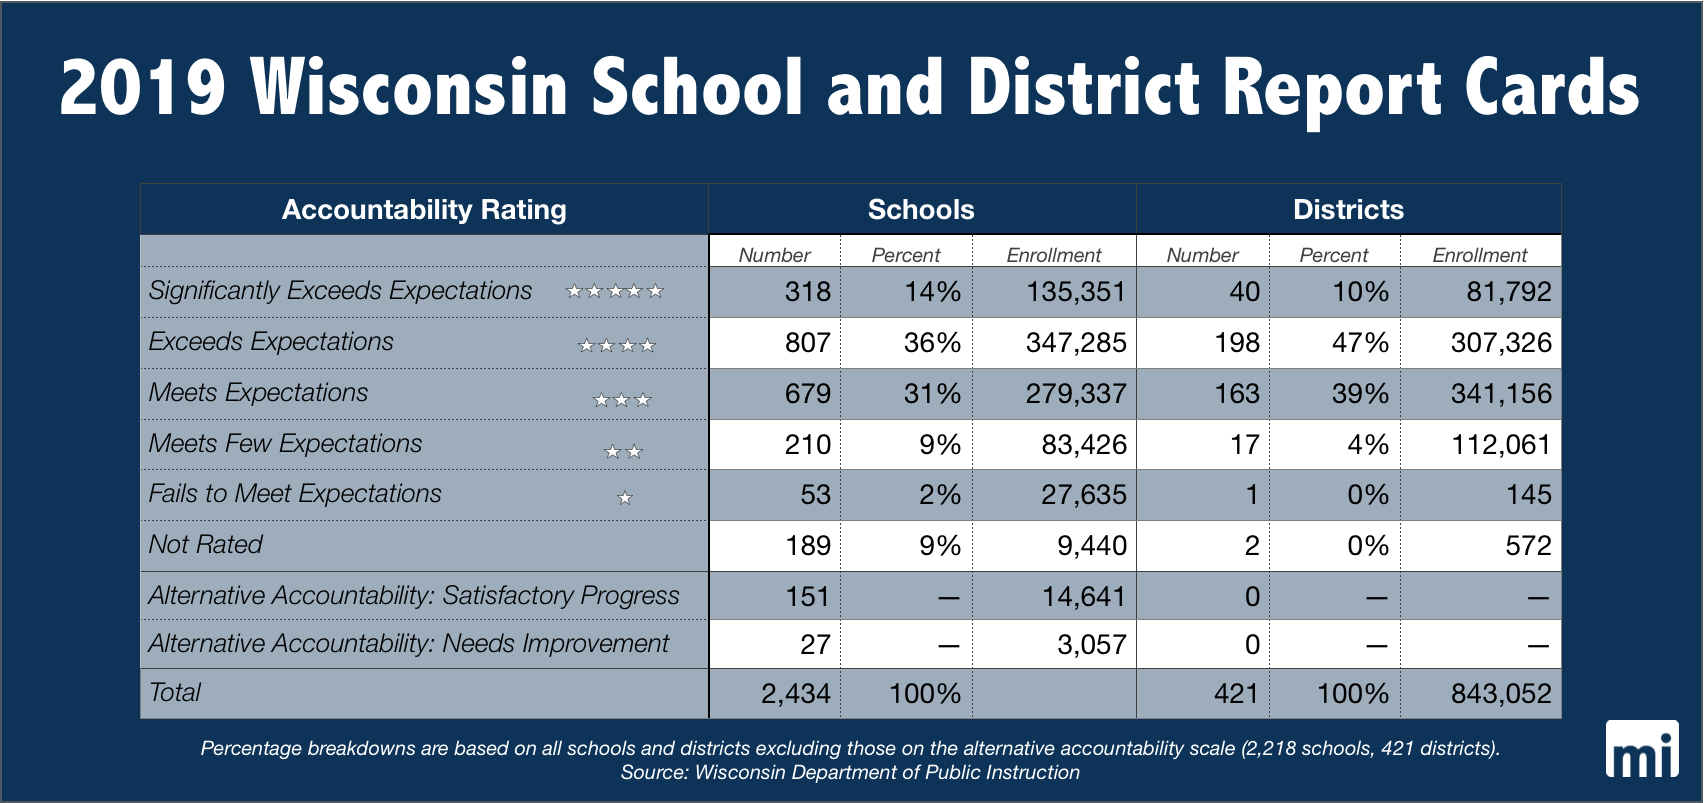
Significantly fewer schools earned failing marks this year. Overall, 53 schools with a combined enrollment of 27,635 students were considered failing. Last year, 95 schools with total enrollment of 40,919 students got one star.
Two-star districts and schools “meet few expectations.” This year, 17 districts earned two stars, including Milwaukee Public Schools (MPS) and Racine Unified School District (RUSD). Last year, 14 districts received two stars.
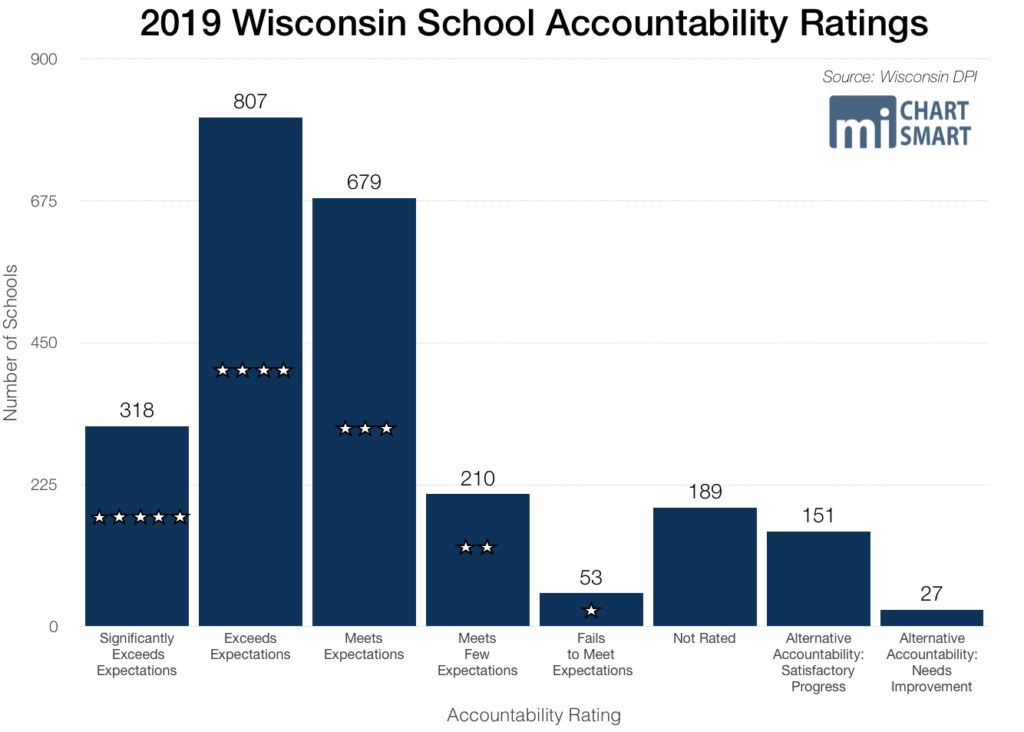
This year, 210 schools met few expectations, down from last year’s 249.
Three-star districts and schools “meet expectations.” This year, 163 districts earned three stars, up from last year’s 152.
For 2019, 679 schools earned three stars, more than 2018’s 671 three-star schools.
Four-star districts and schools “exceed expectations.” The majority of school districts, 198, fell into this category. Last year, 206 districts earned four stars.
More schools fell into the four-star category than any other, with 807 schools exceeding expectations. That’s more than last year’s 768 schools.
Finally, five-star districts and schools “significantly exceed expectations.” In all, 40 school districts earned top marks, down from last year’s 49.
A total of 318 schools earned five stars, down from last year’s 327 schools. However, more large schools fell into the category, as total enrollment in five-star schools increased from 123,073 to 135,351.
Mercer School District received the lowest overall score in the state for the second year in a row, with 50.4 out of 100 total points. The district earned two stars last year, with a total score of 55.9 of 100. Just 145 students attend the district.
Arrowhead UHS School District earned the highest district score in the state, with 89.7 out of 100 points.
At 27.4 out of 100 points, North Division High School at MPS had the worst school score in the state. Just 1.9 percent of students at North Division are proficient in math, and 1.0 percent are proficient in English language arts.
Milton Consolidated Elementary School had the highest score of any school with 99.2 out of 100 points. This year, 85.7 percent of students were proficient in math and 81 percent were proficient in English language arts.
Report card scores are based upon a calculation of four priority areas: student achievement, school growth, closing gaps between student groups, and metrics measuring postsecondary readiness. Districts with larger percentages of impoverished students receive heavier weights for year-over-year growth rather than overall achievement.
In 2019, 27,635 students attend 53 schools ranked as failing to meet expectations.
The report cards also deduct points for high levels of student absenteeism and drop out rates. This year, 153 school report cards lost points for absenteeism higher than 13 percent. Last year, 125 schools had high absenteeism.
This is the fourth year that private schools in the Milwaukee, Racine, and statewide parental choice programs received report cards. Overall, 322 private choice schools and 2,112 public schools received report cards. All of the schools that were not rated were private choice schools with insufficient data for report cards.
Read more about report cards for Milwaukee, Racine, parental choice programs, and charter schools here.
ACT Exam
High school students across the country take the ACT Exam for college, and Wisconsin has one of the highest participation rates for the ACT in the country. Wisconsin students earned an average composite score of 19.6 out of 36, lower than the prior year’s average of 19.8. Overall, students fared the best in the reading section, earning an average of 20.0 out of 36 points. At 18.0 out of 36, English language arts had the lowest average score among students.
Students in the Wisconsin Parental Choice Program (WPCP), also known as the statewide choice program, scored an average of 20.6 out of 36 points on the ACT with writing, higher than last year’s score of 20.1 points. Wisconsin students statewide scored an average of 19.6 out of 36 points on the ACT, lower than last year’s average of 19.8 points.
Statewide, the average English language arts score was 18.0 out of 36, and the average math score was 19.4 out of 36. WPCP students outscored in those subjects too, with 19.3 points in English language arts, and 19.8 points in math.
Students in the Milwaukee and Racine Parental Choice Programs (MPCP and RPCP, respectively) also outperformed their public school peers. The average composite score for MPCP was 16.8 out of 36, higher than MPS’ average score of 15.5. In the RPCP, students earned an average of 17.6 out of 36 points, higher than Racine Unified School District’s average score of 16.9.
Non-Academic Metrics
The 2019-21 State Budget
As former state Superintendent of the Department of Public Instruction (DPI), Gov. Tony Evers made K-12 education a top priority in his 2019-21 biennial budget proposal. That is, as long as students attend the types of schools he prefers.
Evers’ massive spending proposal called for nearly $1.6 billion more for DPI over the biennium, another record hike over the prior budget’s increase of more than $630 million. It would have dramatically reworked the school funding formula, and it also drastically restricted access to educational choice.
In the end, Evers’ veto pen increased DPI’s overall spending to a more than $700 million hike over the biennium. The state aid spending increase to DPI is the largest across all agencies.

With the veto pen, districts will receive larger per pupil aid payments for each student – up from $654 this year to $742 in each of the next two years. That totals nearly $90 million more in overall state spending. Evers also vetoed out an $18 million program that provides free laptops for all high school freshmen.
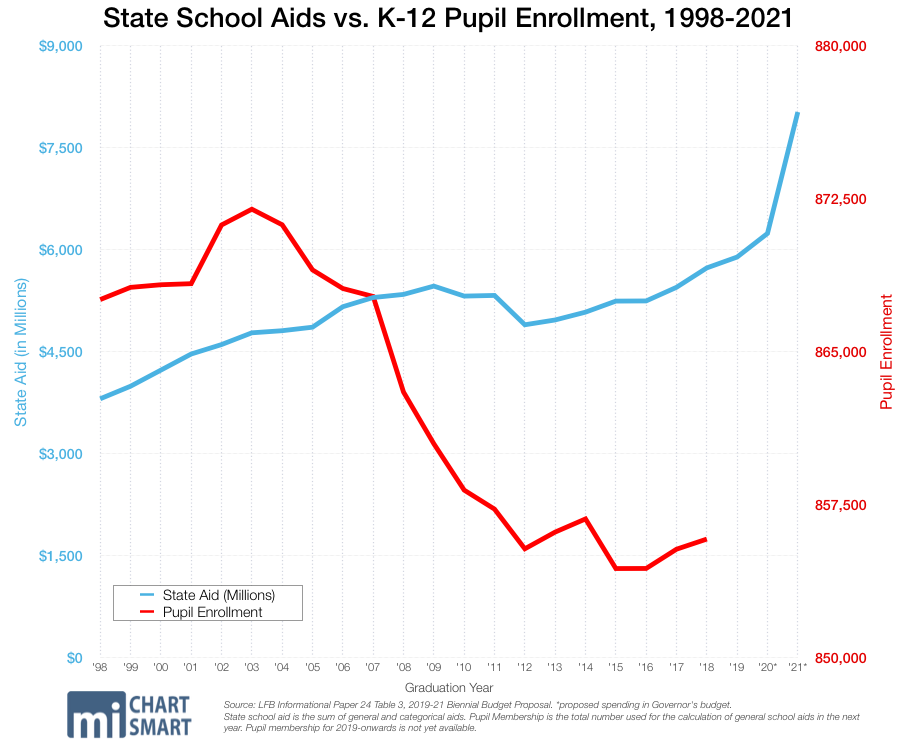
The extra money comes with zero reforms for an underperforming education system with flat enrollment. In this biennium, state support to K-12 schools will reach more than $14 billion in the biennium, and DPI’s total budget spends north of $15.2 billion. Evers’ original proposal included more than $600 million to increase special education categorical aids. JFC sent $330 million more into the equalization aid formula, $97 million more for special education categorical aids, along with a litany of other changes.
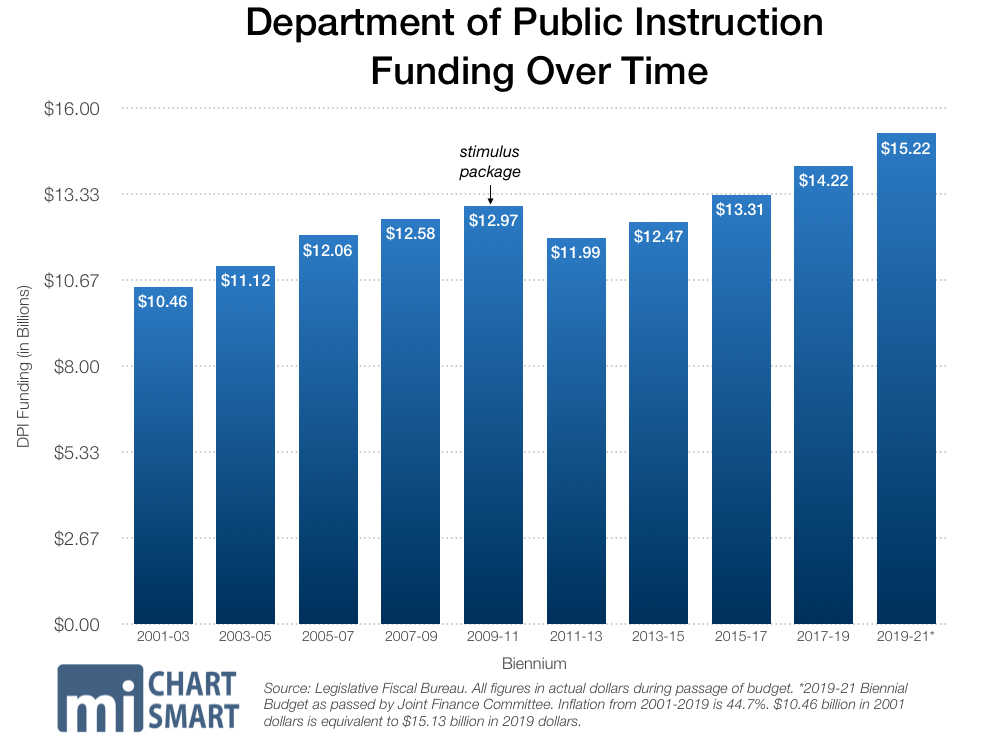
Lost in this debate is the fact that student enrollment has slowly declined over the years as families opt for other educational choices outside of the public education system. In the current school year, more than 853,000 children attend Wisconsin public schools, a figure that has fallen for years. At the same time, K-12 investments have increased. The state continues to spend more money to educate fewer children. Which brings us to…
Enrollment
Overall student enrollment continues to fall, though the 0.15 percent decrease is smaller than in recent years. The third-Friday headcount in September of 2018 showed that 858,833 children attend Wisconsin K-12 schools. The previous year, the headcount had fallen by 0.43 percent.
Wisconsin has seen declining enrollment in its schools for years. At the same time, spending on the public education system has increased dramatically.
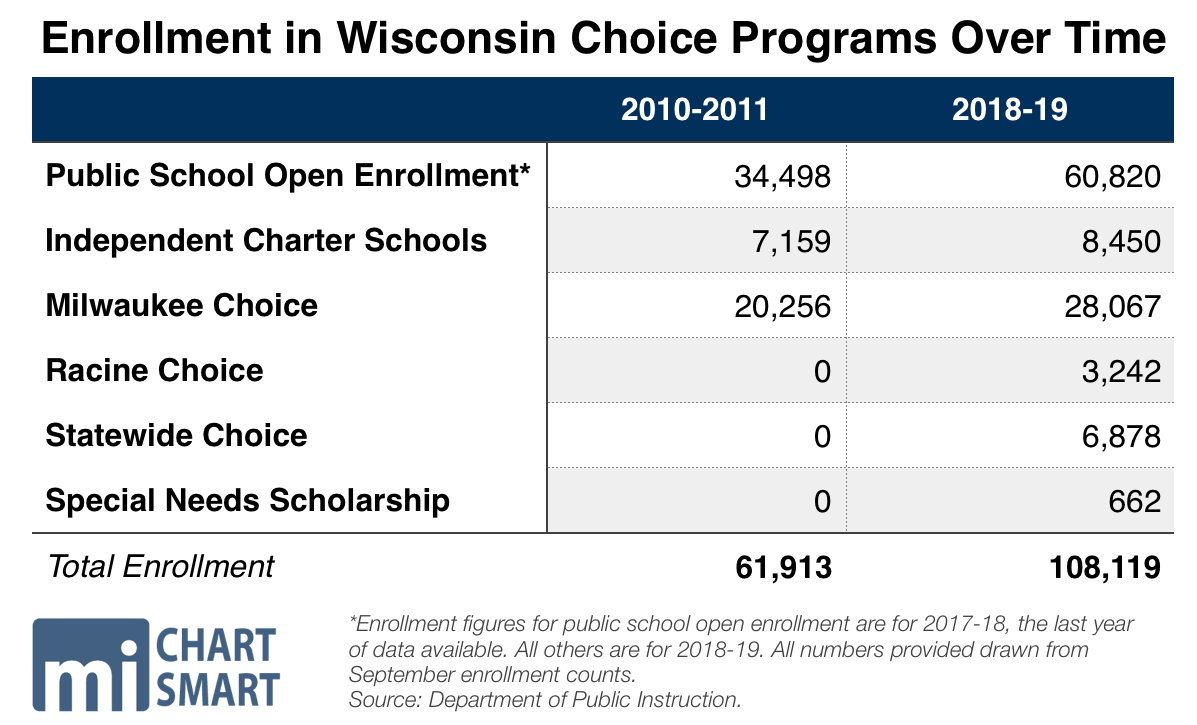
While fewer students attend traditional public schools in the state of Wisconsin, more have utilized forms of school choice. The most popular form of choice is public school open enrollment, which allows students to attend public schools outside of their home districts. In the 2018-19 school year, more than 60,000 students participated in open enrollment, a 76 percent increase from 2010-11.
Students can also attend private schools using the parental choice programs in Milwaukee, Racine, and statewide. More than 38,000 students are enrolled in private schools thanks to those three programs, an 89 percent increase from the 2010-11 school year.
Students can only participate in the parental choice programs if their family incomes are below certain limits. In Milwaukee and Racine, families can earn up to 300 percent of the federal poverty level to qualify. For a family of four, that amounts to $75,300 for the 2019-20 school year. Outside of those two cities, the limit is 220 percent of the poverty level, or $55,220 for a family of four.
Since the school choice programs have income limitations on participation, these programs have much higher rates of economically disadvantaged students than the general Wisconsin population. For that reason, their academic performance is typically compared to economically disadvantaged students in public schools. Wisconsin choice students have shown that they not only outperform similar peers in public schools, but also the general population. Students in all three programs received higher ACT scores this year than their public school peers.
The most recent DPI report cards also show the impact of school choice. Of the 17 schools at MPS that received five stars on 2018 report cards, 10 are private choice and four are charters. Just three traditional public schools at MPS received five stars in 2018.
Attendance, Dropout Rates, and Expulsions
DPI’s February data release included a slew of non-academic information for the 2017-18 school year. Both attendance rates and dropout rates fell by a hair compared to the prior year. Overall, students had a 93.9 percent attendance rate in the 2017-18 school year, down from 94 percent in 2016-17. The statewide dropout rate fell to 1.4 percent this year, down from 1.5 percent the prior year. While a minuscule difference, the attendance rate is now at a five-year low. In the 2013-14 school year, attendance was 95 percent.
School discipline rates are part of a new set of data first published in Wisconsin’s WISEdash system for the 2016-17 school year. Those figures show a troubling increase in incident reports involving students — from assault, drugs and alcohol, endangering behavior, weapon related, and all other violations of school rules, the incident rate for all students increased to 8.1 percent in 2018. The prior year, the student incident rate was 6.8 percent.
Statewide, 554 students were expelled in the 2017-18 school year, and 8.2 percent received out-of-school suspensions. That marks a 22 percent increase in the number of expulsions from 2016-17, when 453 students were expelled. That year, 6.8 percent of students received out-of-school suspensions.
—
That wraps up The MacIver Institute’s State of Education for 2019. We hope you enjoyed reading about the many trends in education that are often lost in the day-to-day news cycle. Wondering about any other data? Drop your questions in the comments below.
